
Fig. 2.
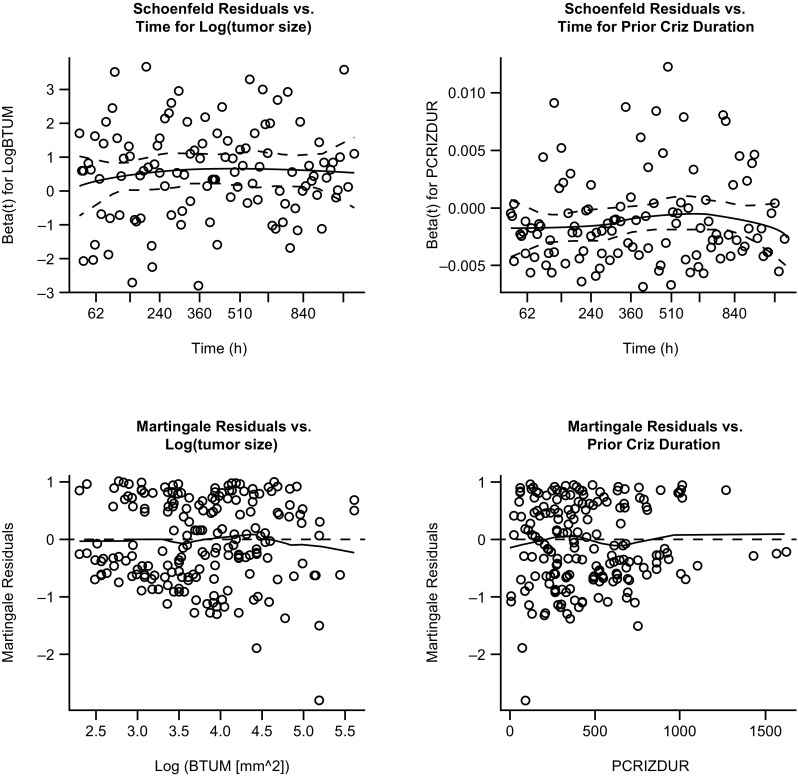
Diagnostic plots from the final Cox proportional hazards model. Top: Schoenfeld residuals from the final model. Solid lines represent locally smoothed fit to the Schoenfeld residuals, and the dash lines represent ± 2-standard-error around the fit. Bottom: Martingale residuals from the final model. The solid line represents locally smoothed fit to the martingale residuals. Martingale residuals should have a range between − ∞ and 1 and mean of zero, and should show no strong trends