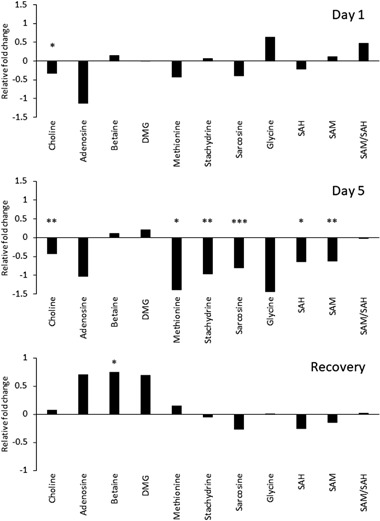
Fig. 7.

Relative changes in the levels of ten metabolites (and one metabolite ratio) involved in the one-carbon cycle in the treatment group compared to age matched control after 1 and 5 days of exposures and after recovery period. Peak area was normalised to the peak area for the internal standard (S-adenosyl-L-methionine-d3). Graph presents the relative log2 fold change of the averaged values of treatment and control group. SAH: S-adenosyl-L-homocysteine; SAM: S-adenosyl-L-methionine. Six replicates were used for each group (*p < 0.05, **p < 0.01, ***p < 0.001, Mann–Whitney test)
