FIGURE 1.

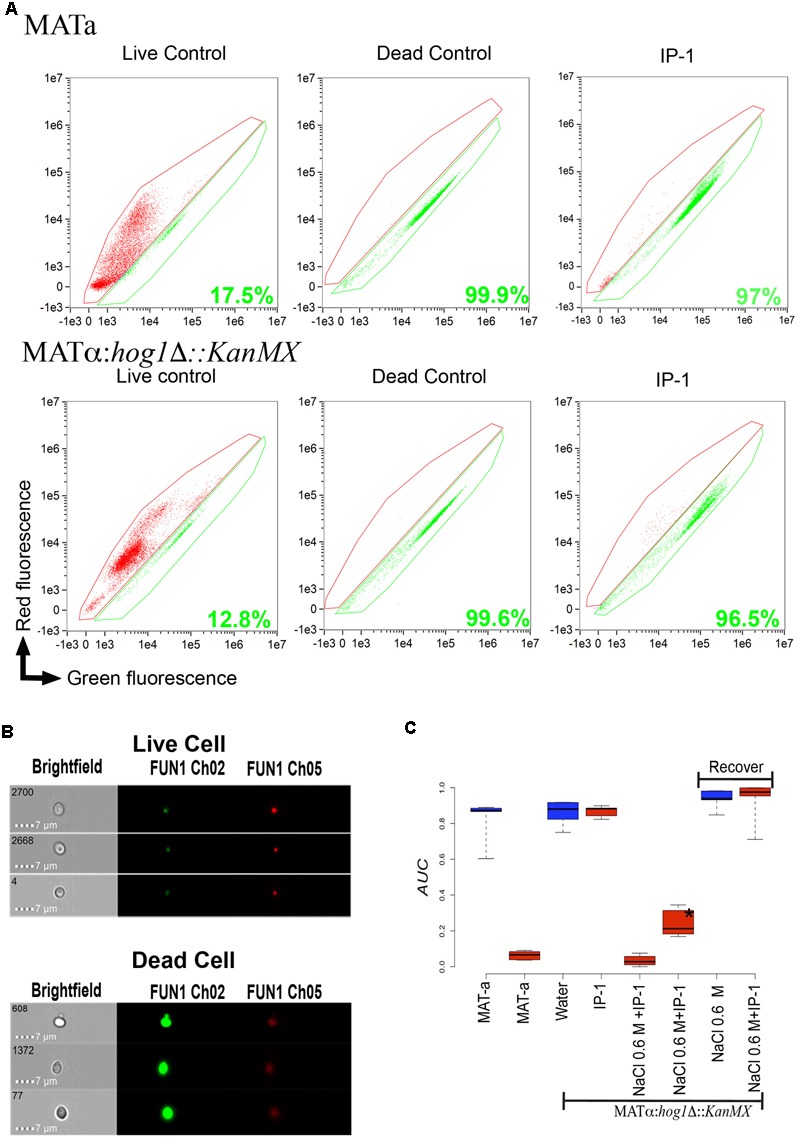
Quantification of cell death induced by IP-1. (A) Dot plot, fluorescence intensity of dying cells (red fluorescence) vs. fluorescence intensity of living cells (green fluorescence); the areas marked in red and green identify the dead and live cells, respectively; the green number in each plot corresponds to the percentage of dead cells found in each treatment for MATa and MATα:Δhog1 cells. (B) The panels show the images of cells recorded by the Amnis instrument (see section “Materials and Methods”) at a magnification of 64× in bright field and red or green fluorescence; in the top panel an example of live cells (cells not exposed to IP-1) is presented and the lower panel shows an example of dead cells (cells heated at 90°C for 1 h). (C) Box plot of the relative area under growth curves (AUCs) of cells (MATa, MATα:hog1Δ::kanMX) exposed to IP-1 (10 μM; red boxes) or water (blue boxes) as control; MATα:hog1Δ::kanMX cells are represented as Δhog1 for abbreviation. The relative AUCs of MATα:hog1Δ::kanMX cells that were arrested by exposure to NaCl and then allowed to recover from this arrest are indicated by the “Recover” label. The figure summarizes the results obtained from three independent experiments.
