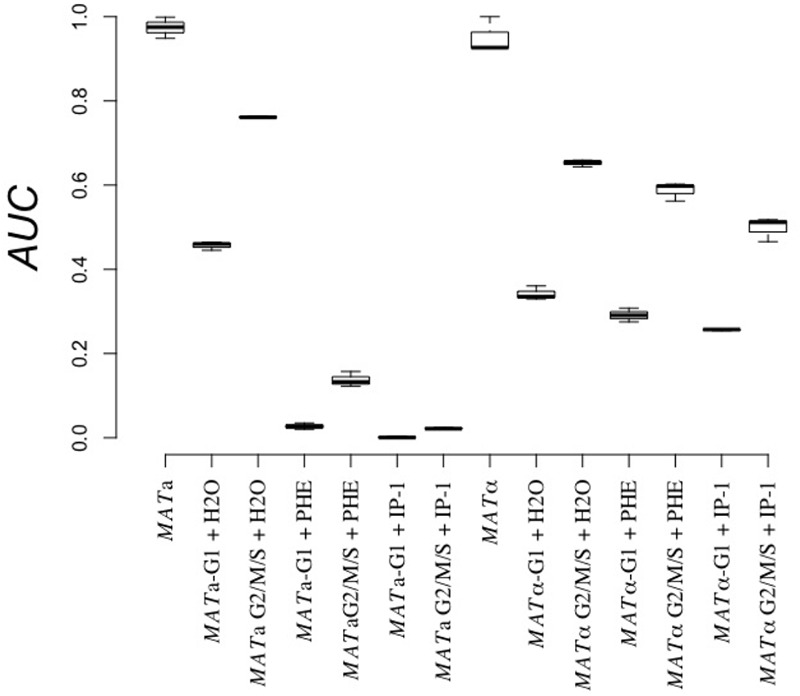
FIGURE 4.

Cell growth effect of IP-1 on cells in G1 vs. other cell cycle phases. BY4741 (MATa) and BY4742 (MATα) cells were elutriated to separate cells in G1 phase from the rest (G2/M/S), then treated separately with 10 μM IP-1 (+IP-1), α-pheromone (+PHE), or distilled water as a control (+H2O). The relative area under the growth curve (AUC) after 24 h of growth is reported. The figure summarizes the results obtained from at least six experiments.
