FIGURE 6.

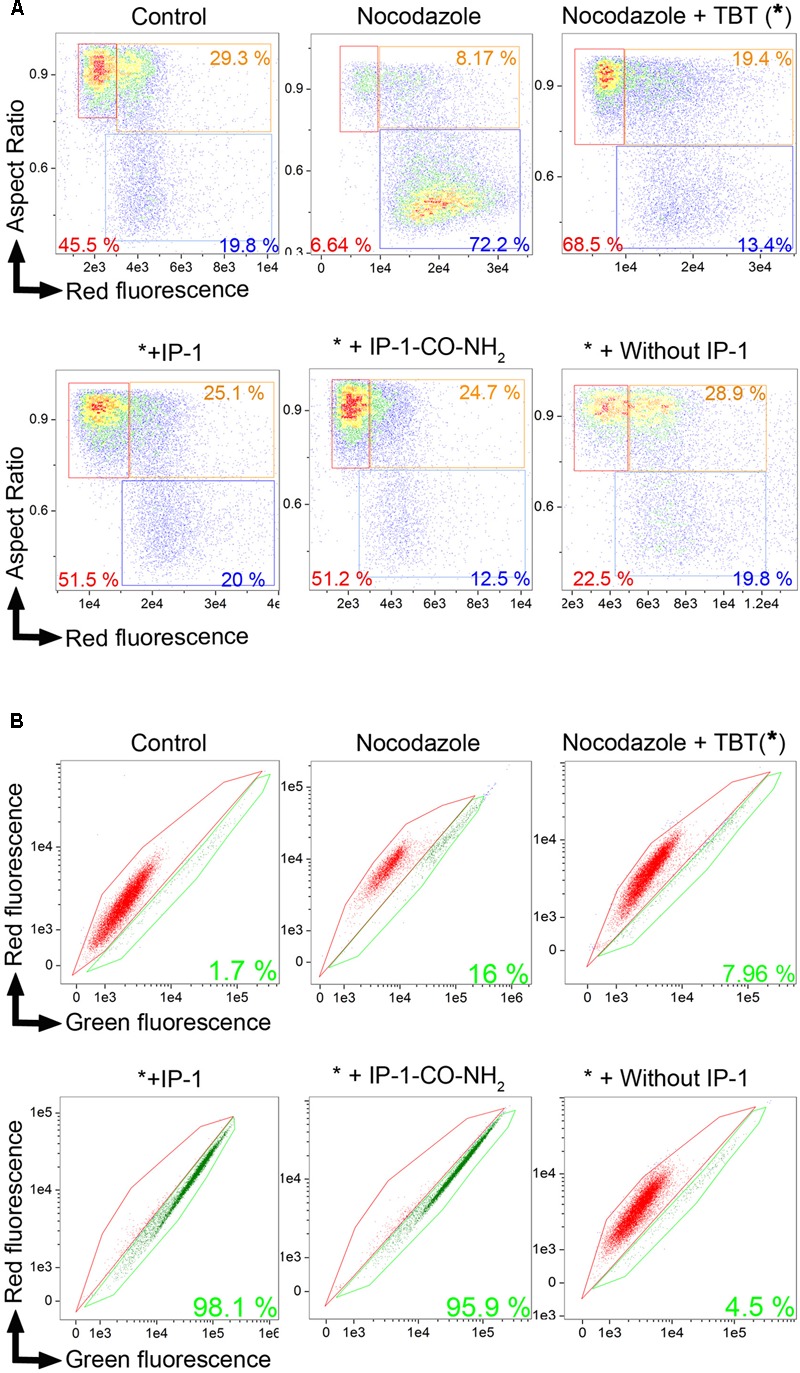
IP-1 induces cell death in MATα cells arrested chemically in G1/G0 phase. BY4742 (MATα) cells in the exponential phase were synchronized with nocodazole in M phase, then arrested with TBT in G1/G0 phase, and treated with 10 μM IP-1 or IP-1-CO-NH2. Cell cycle analysis and the FUN 1 assay were performed after each treatment. Treatment with nocodazole and TBT is represented by an asterisk (∗) for abbreviation. (A) Dot plot, cell aspect ratio vs. cell death fluorescence intensity, allowing for identification of cells in G1/G0 phase (red box), cells in S phase (orange box), or cells in G2/M phase (blue box); the number in each box refers to the percentage of each cell phase in 15,000 cells analyzed. (B) FUN1 cell viability assay. A bivariate plot of the intensity in red and green channels was generated from the in-focus population. Red area contains live cells while green area contains dead cells. The percentage of live cells among the 15,000 cells analyzed in each condition is indicated in the corresponding color. Only one experimental result is presented in this image, but these results were confirmed by a second independent experiment not shown.
