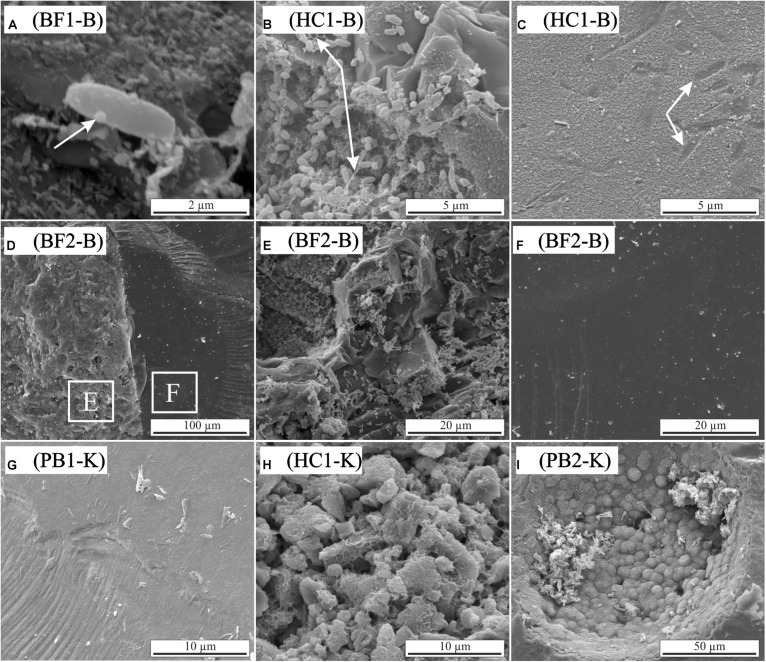
FIGURE 5.
Scanning electron micrographs of biotic and abiotic incubation experiments with HSDP2 core samples (A–F: biotic experiments; G–I: abiotic experiments). (A) Single cell with small particles adhering to its surface. (B) Clusters of cells connected by filamentous structures. (C) Altered glass surface with possible imprints of microbial cells. (D) Basaltic flow (BF2) showing basaltic glass (left) and olivine crystal (right). (E,F) Enlargement of the areas indicated in image (D). Glass (E) is intensively colonized by cells of B. fungorum whereas cells are absent on olivine surfaces (F). (G) Abiotic altered glass surface covered with alteration products. (H) Small particles cemented in mesh-like alteration products. (I) Porous spherical structures in a primary vesicle.

