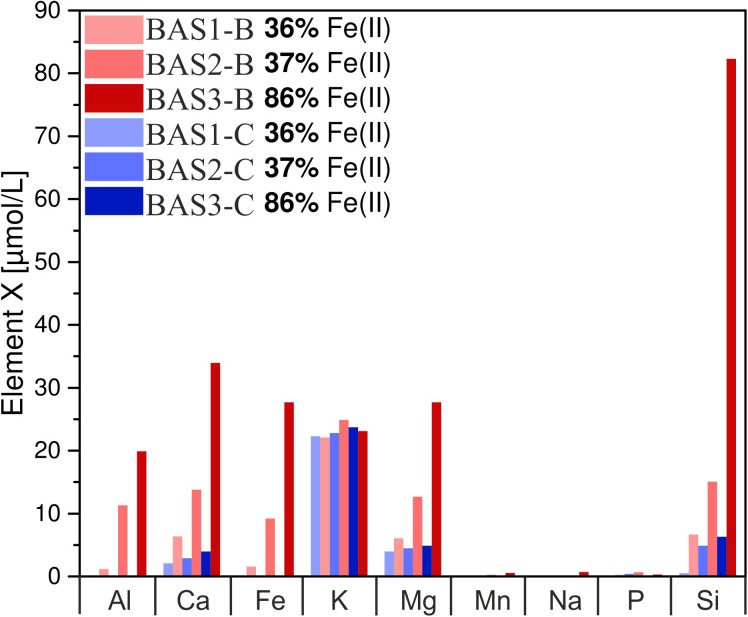
FIGURE 6.
Concentration of dissolved major elements in biotic (red) and abiotic (blue) colonization experiments after 42 days. Note that concentrations have been measured in one of the parallels only and these data represent absolute values. The sample suffix –B and –C denotes biotic and abiotic (control) experiments, respectively. BAS1, annealed (no residual stress), low Fe(II) content; BAS2, quenched (residual stress), low Fe(II) content; BAS3, quenched (residual stress), high Fe(II) content.

