Figure 6.
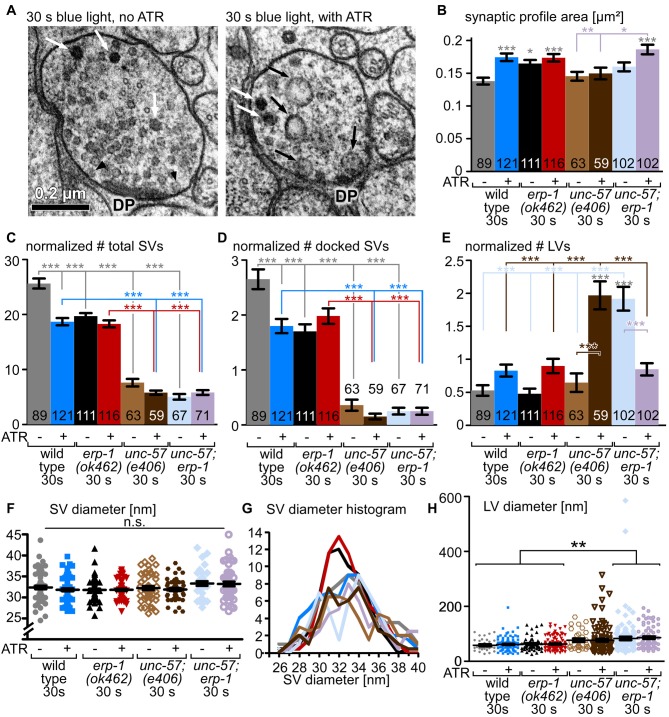
Transmission electron microscopy (EM) analysis of unc-57, erp-1 and unc-57; erp-1 mutants. (A) Example thin sections of wild-type cholinergic synapses expressing ChR2 (transgene zxIs6, as in all panels in this figure), photostimulated for 30 s, and high-pressure frozen after an additional 5–6 s. Left: animal was raised in the absence of ATR. Right: animal was raised in the presence of ATR. Relevant structures are indicated: DP: proteinaceous material at the center of the active zone; black arrowheads: docked SVs; white arrows: dense core peptidergic vesicles; black arrows: LVs, end-products of ultrafast/bulk endocytosis events. (B) Mean and SEM analysis of the dimensions (area) of the synaptic profiles analyzed for each condition and genotype, as indicated. Two to three animals and 9–19 synapses, with 59–121 profiles were analyzed for each condition; the erp-1; unc-57 double mutant was analyzed in two technical replicates (see Supplementary Table S1). (C–E) Mean and SEM analysis of structures (total SVs, docked SVs, LVs, as indicated) counted in the observed synaptic profiles, normalized to a typical synaptic profile area or perimeter (for docked SVs), for the indicated genotypes and experimental conditions. (F,G) Analysis of SV diameter (single SVs scatter plot, mean and SEM in (F); occurrence of distinct SV diameters, smoothed with a sliding average of the two neighboring values in the histogram, in G); for an analysis of mean SV diameters, see Supplementary Figure S4. (H) Analysis of mean and SEM of observed LV diameters, incl. scatter plot of largest diameter of the single LVs observed. Statistical analysis: one-way ANOVA with Tukey correction in (B–F,H) ***p < 0.001; **p < 0.01; *p < 0.05.

