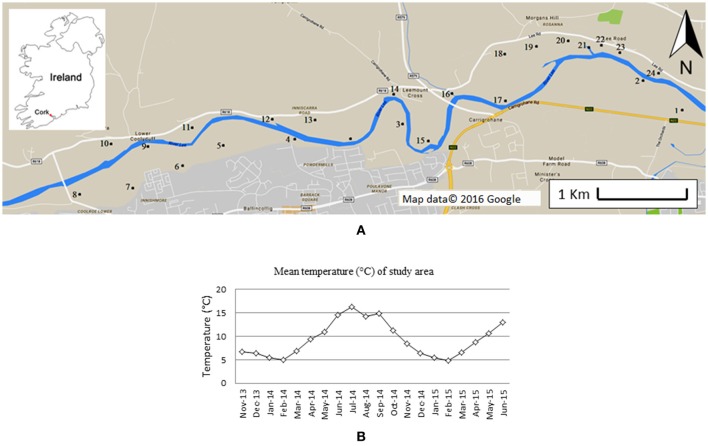
Figure 1.
Map of the area monitored (A). Numbers indicate the sites investigated. Insert shows the location within Ireland. In (B) the average monthly temperature during the time frame of this study is showed. Data were provided by the Irish Meteorological Service, and measured at Cork airport meteorological station (51°50′50″ N 8°29′10″ W). Figure adapted from Paolacci (2016).

