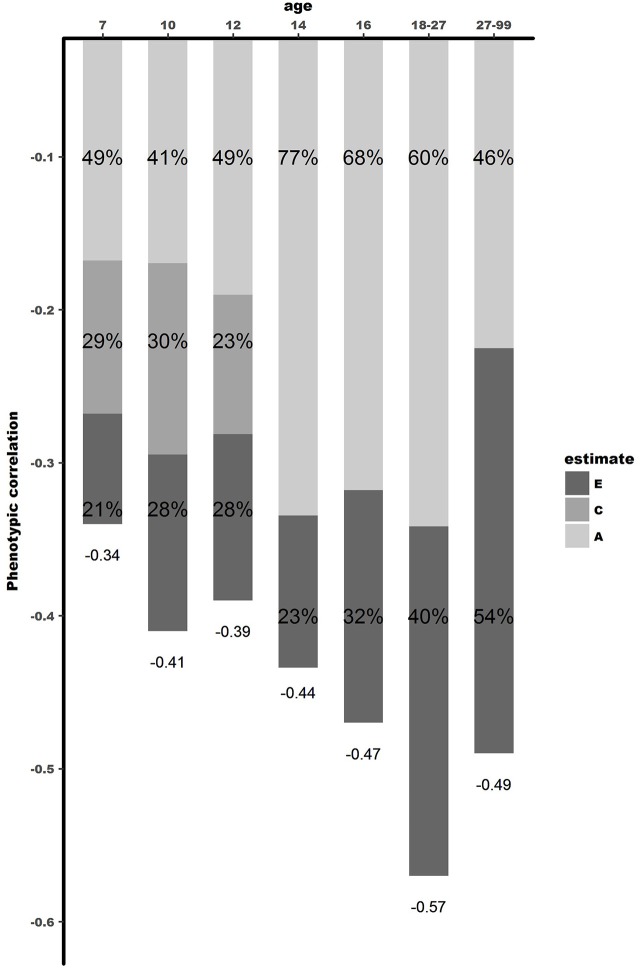
Figure 2.
Dissection of phenotypic correlation between well-being and depressive symptoms over the lifespan by shared genetic -and environmental effects. A is the proportion of phenotypic correlation explained by shared genetic effects, C by shared environmental effects, and E by unique environmental effects.

