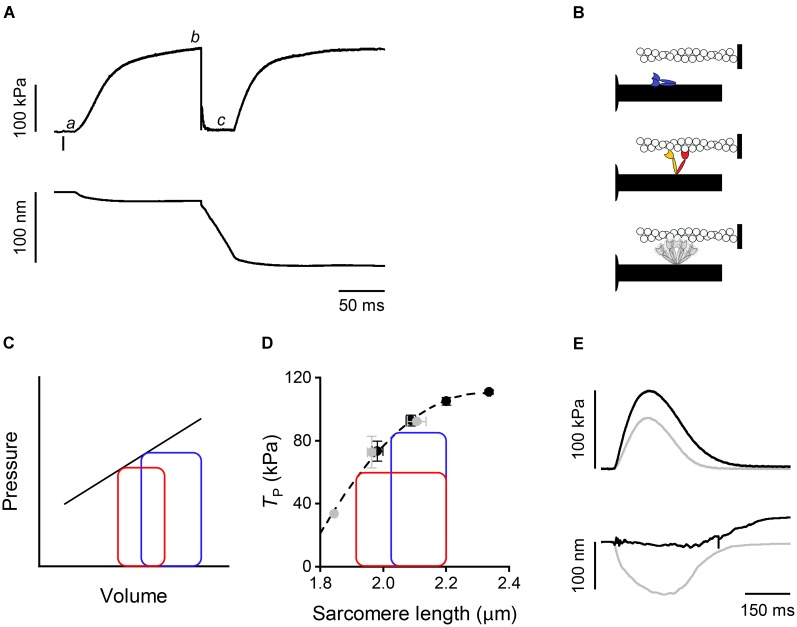
FIGURE 1.
Mechanical responses in skeletal and cardiac muscle and schematic of myosin motor configurations. (A) Force (upper panel) and half-sarcomere length change (lower panel) as measured by the striation follower (Huxley et al., 1981) during a tetanic stimulation of a single fiber dissected from frog muscle (at 4°C and SL 2.15 μm). The small bar below the force trace indicates the time of the first stimulus. a: latency period; b: plateau of force attained in isometric conditions; c: phase in which a shortening at V0 is imposed on the fiber. (B) Schematic of the motor conformation in various states: blue, OFF state; red, attached force-generating motor; orange, detached partner of the attached force-generating motor; gray, detached dimer in the ON state. (C) Pressure–volume loops with two different diastolic filling (preload): blue, high preload; red, low preload. The straight line describes the end-systolic pressure–end-systolic volume (ESPV) relation. (D) Relation between force at the peak of the twitch and sarcomere length in a cardiac trabecula at 2.5 mM Ca2+ and 27°C. Gray circles, FE conditions; black circles, LC conditions. The dashed line is the exponential fit to the experimental points. The two loops are ideal pressure–volume loops drawn assuming that two isometric contractions start at the same SL (2.2 μm) and become isotonic at two different levels of force corresponding to two different points in the ESPV relation depending on the blood pressure. (E) Force (upper panel) and half-sarcomere length changes (lower panel) during a trabecula twitch under fixed-end (gray) and length clamp (black) conditions at 2.5 mM Ca2+ and 27°C.

