Figure 2.

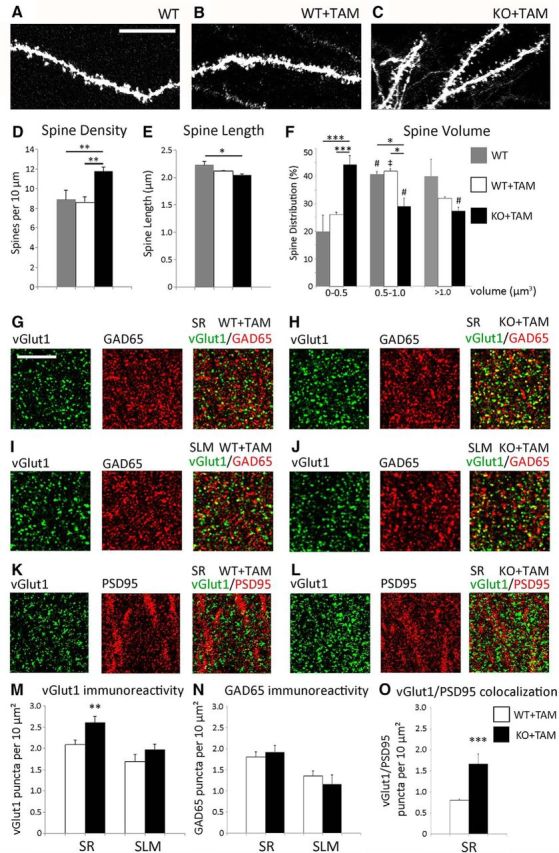
Synaptogenic effects of astrocyte-specific deletion of ephrin-B1 in the CA1 hippocampus. A–C, Max projection confocal images of DiI-labeled dendrites of CA1 neurons in the SR area of CA1 hippocampus of WT, WT+TAM, and KO+TAM adult mice. Scale bar, 5 μm. D–F, Graphs show the average number of dendritic spines per 10 μm dendrite (D), average spine length (E) and spine volume (F). D, There is a significant 36% increase in average dendritic spine density in KO+TAM mice compared with WT and WT+TAM mice; error bars represent SEM (n = 3–6 mice, WT: 8.91 ± 0.93 WT+TAM: 8.65 ± 0.51 vs KO+TAM: 11.77 ± 0.46; F(2,98) = 9.199, p = 0.0002; one-way ANOVA, Tukey's post hoc test, **p < 0.01). F, A significant twofold increase in the proportion of dendritic spines with smaller heads (volume 0–0.5 μm3) and a decrease in percentage of mature spines with volume 0.5–1.0 μm3 are observed in KO+TAM group compared with WT and WT+TAM groups (n = 3–6 mice, F(14,45) = 36.19, p < 0.0001 and F = 7.701 p < 0.05, respectively; two-way ANOVA followed by Tukey's post hoc, *p < 0.05, ***p < 0.001). WT and WT+TAM groups exhibit a significantly higher proportion of spines with larger heads (volume 0.5–1.0 μm3) than the spines with smaller heads (volume 0–0.5 μm3; n = 3–6 mice, one-way ANOVA, Tukey's post hoc test, #p < 0.05, ‡p < 0.001, F = 4.462). KO+TAM group shows a significantly lower proportion of spines with larger heads (volume 0.5–1.0 μm3 and >1.0 μm3) than spines with smaller heads (volume 0–0.5 μm3; n = 3–6 mice, one-way ANOVA, Tukey's post hoc test, #p < 0.05, F = 4.462). G–J, Confocal images showing vGlut1 (green) and GAD65 (red) immunolabeling in SR (G, H) and SLM (I, J) areas of the CA1 hippocampus of WT+TAM (G, I) and KO+TAM (H, J) adult mice. Scale bar, 50 μm. K, L, Confocal images showing vGlut1 (green) and PSD95 (red) immunolabeling in SR area of the CA1 hippocampus of WT+TAM (K) and KO+TAM (L) adult mice. M, N, Graphs show the density of vGlut1 and GAD65-positive puncta per 10 μm2 of the SR and SLM areas in the CA1 hippocampus of WT+TAM and KO+TAM mice. M, There is a significant 25% increase in vGlut1-positive puncta in SR but not SLM area of KO+TAM compared with WT+TAM group; error bars represent SEM (n = 3–6 mice, WT+TAM: 2.09 ± 0.11 vs KO+TAM: 2.61 ± 0.14, t(64) = 2.89, p = 0.0053, t test, **p < 0.01). N, There was no significant difference in the number of inhibitory GAD65-positive puncta between WT+TAM and KO+TAM mice (n = 3–6 mice, WT+TAM: 1.68 ± 0.18 vs KO+TAM: 1.97 ± 0.13, t(64) = 1.124, p = 0.2654, t test). O, Graph shows the density of colocalized vGlut1 and PSD95-positive puncta per 10 μm2 in the SR area of the CA1 hippocampus of WT+TAM and KO+TAM mice. There is a significant increase in vGlut1/PSD95 colocalization in KO+TAM compared with WT+TAM group, error bars represent SEM (n = 3 mice, WT+TAM: 0.800 ± 0.031 vs KO+TAM: 1.666 ± 0.232, t(14) = 4.198, p = 0.0009, t test, ***p < 0.001).
