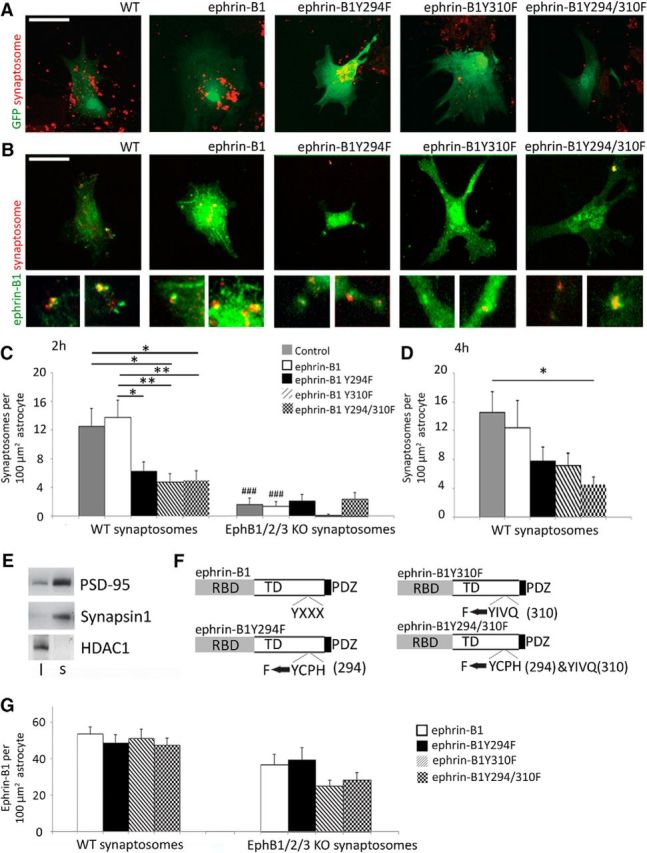
Figure 6.

Ephrin-B1 reverse signaling triggers synaptosome engulfment by astrocytes. A, B, Confocal images of primary astrocytes expressing ephrin-B1, ephrinB1-Y294F, ephrinB1-Y310F, or ephrinB1-Y294/310F with (A) or without GFP (B) that were cocultured with DiI-labeled synaptosomes (red) isolated from adult mouse hippocampi for 2 h. C, D, Graphs show the integrated density of DiI-labeled synaptosomes in astrocytes treated for 2 h (C) or 4 h (D) with WT (C, D) or EphB1,2,3 KO synaptosomes (C). Astrocytes expressing ephrin-B1 contained significantly more WT synaptosomes than synaptosomes lacking EphB1/2/3 receptors 2 h after addition of synaptosomes (n = 28–30 cells; WT: 12.99 ± 2.40 vs EphB1/2/3 KO: 2.11 ± 0.71, F(9,248) = 10.04, p = 0.000154, one-way ANOVA, Tukey's post hoc test; ###p < 0.001). Astrocytes expressing ephrin-B1Y294Y/Y310F mutant had significantly decreased synaptosome engulfment compared with astrocytes expressing ephrin-B1 (ephrin-B1Y294F/Y310F mutant astrocytes: 5.04 ± 1.27 vs ephrin-B1-expressing astrocytes: 12.99 ± 2.40, F(9,248) = 10.04, p = 0.009, ANOVA, Tukey's post hoc test; *p < 0.05, **p < 0.01). Graphs show mean values and error bars represent SEM. E, Western blots showing enrichment of synaptic proteins (PSD95 and synapsin1) and a decrease in nuclear protein HDAC1 in isolated synaptosomes. F, Schematics of ephrin-B1 and ephrin-B1 mutants with tyrosine (Y) to phenylalanine (F) mutations. G, Graphs show ephrin-B1 immunoreactivity per 100 μm2 primary hippocampal astrocytes treated with synaptosomes isolated form WT or EphB1,2,3 KO mice. Graphs show that there are no significant differences in ephrin-B1 levels in primary astrocytes transfected with pcDNA3ephrin-B1, pcDNA3ephrinB1Y294F, pcDNA3ephrinB1Y310F, or pcDNA3ephrinB1Y294/310F. Graphs show mean values and error bars represent SEM (n = 28–30 astrocytes, one-way ANOVA followed by Tukey's post hoc test).
