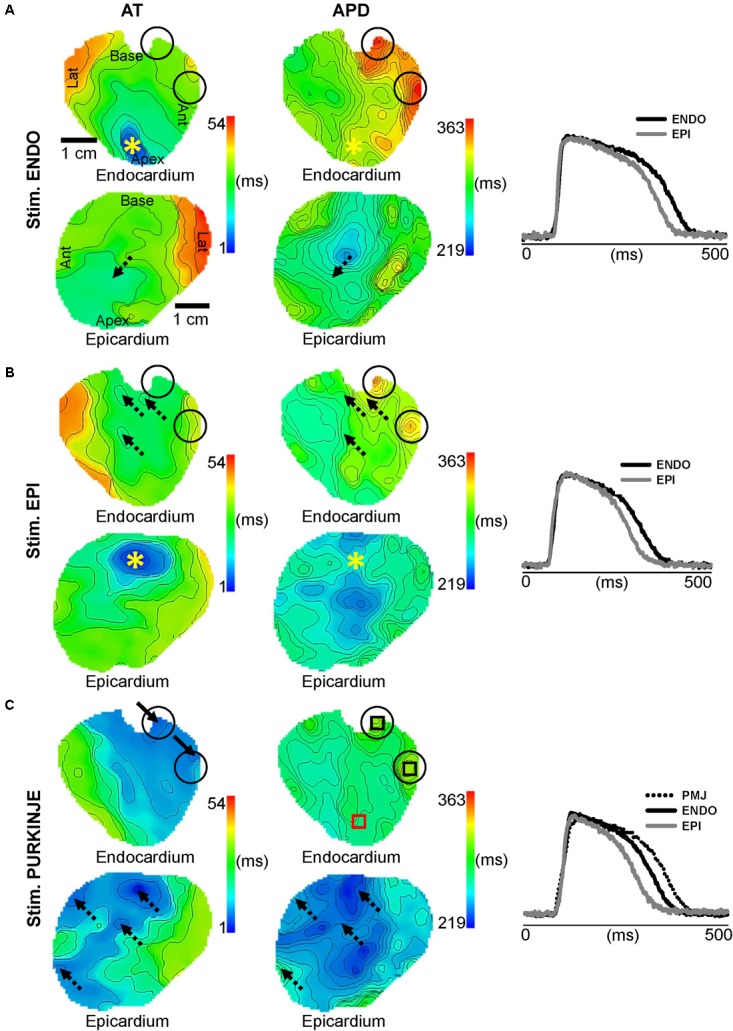
FIGURE 2.

Influence of pacing location on endocardial and epicardial APD. Endocardial and epicardial AT and APD maps and corresponding AP traces derived from LV preparations when pacing at 1 Hz on the ENDO (A), EPI (B), or PF (C), by site marked (∗). (C) Origins of early activation during PF pacing are localized by arrows. Regions for APD measurements are indicated by the black boxes for PMJs and the red box for ENDO. Dashed arrows show origins of breakthrough. Black circles show PMJs location on AT and APS maps for all pacing sites. Isochrones are 5 ms spacing for AT and APD maps.
