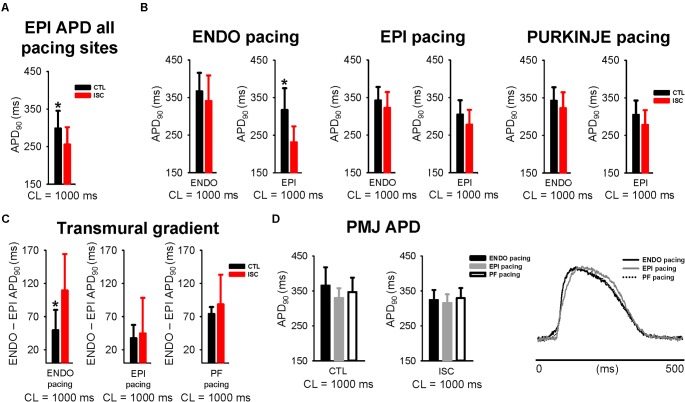
FIGURE 5.
Greater resistance of Purkinje network to ischemia. (A) Mean ± SD EPI APD across all pacing locations at 1 Hz, before and after 7 min of ischemia. CTL, control; ISC, ischemia. (B) Mean ± SD APD from ENDO and EPI surfaces for each stimulus location stimulation at 1 Hz (before and after ISC). (C) Transmural differences of APD when pacing ENDO, EPI, and PF at 1 Hz, before and after ISC. (D) Mean ± SD PMJ APD (upper panel) and corresponding AP traces (lower panel), as in Figure 3, are shown for all pacing locations, before and after ISC. Statistical differences were determined by paired t-tests (∗p < 0.05).

