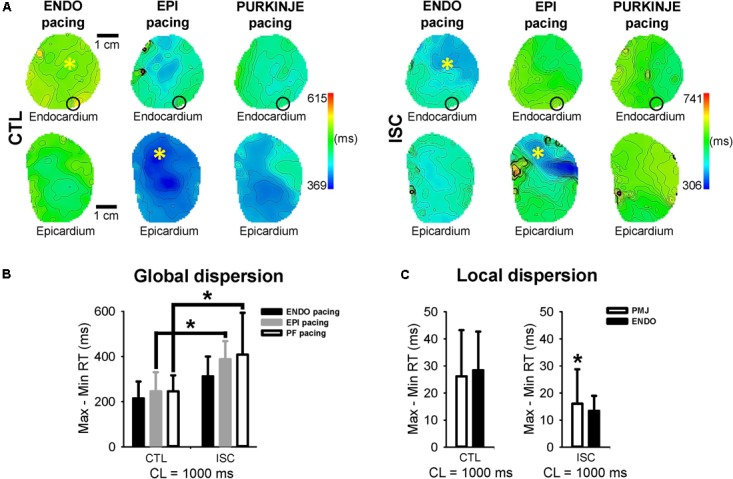
FIGURE 6.

Impact of pacing sequence on dispersion of repolarization during acute ischemia. (A) RT endocardial and epicardial maps for the different pacing modalities in control conditions and after 7 min of ischemia. Stimulation sites are indicated by (∗) and black circle shows PMJ location for all pacing sites. Isochrones are 10 ms spacing. CTL, control; ISC, ischemia. (B) Mean ± SD global RT dispersion when pacing ENDO, EPI, and PF at 1 Hz, before and after ISC. Statistical differences were determined by two-way ANOVA (∗p < 0.05). (C) Mean ± SD local RT dispersion at PMJs compared to endocardium, before and after ISC. Statistical differences were determined by paired t-test (∗p < 0.05).
