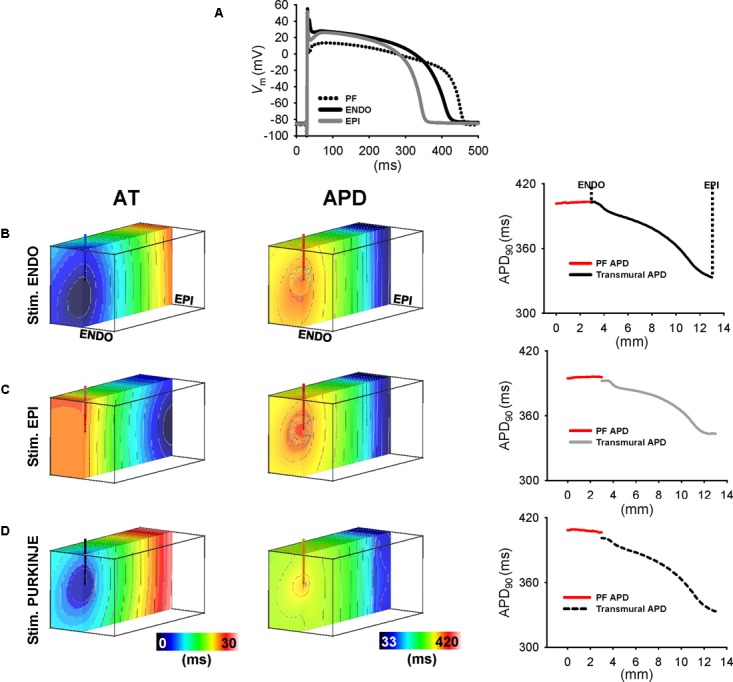
FIGURE 7.

Transmural APD heterogeneity in human ventricular wedge model. (A) APs derives from human from PF, endocardial, and epicardial ionic models of control heart. Shown are the last of a train of 100 APs stimulated at 1 Hz. AT and APD maps in simulations from transmural cross-sections of wedges for ENDO (B), EPI (C), and PF (D) stimulation at 1 Hz. Right panels show transmural APD profiles intersecting the PMJ and APD profiles along the free-running PF (red line). Isochrones are 2 ms spacing for AT maps and 5 ms for APD maps.
