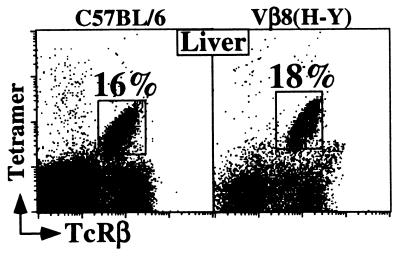
Figure 4.
α-GalCer/CD1d tetramer+ populations are detected in HY Vβ8.2 TcR transgenic mice. The FACS dot plots display the α-GalCer/CD1d tetramer vs. TcRβ profiles of cell suspensions obtained from the liver of C57BL/6 and Vβ8.2 (anti-H-Y) transgenic mice. The expression of the Vβ8.2 transgene by tetramer+ T cells in the liver of transgenic mice was ensured by the absence of staining with another endogenous Vβ (anti-Vβ7) Abs (data not shown). The percentage of tetramer+ cells from one representative experiment is shown; three mice from each strain were analyzed.

