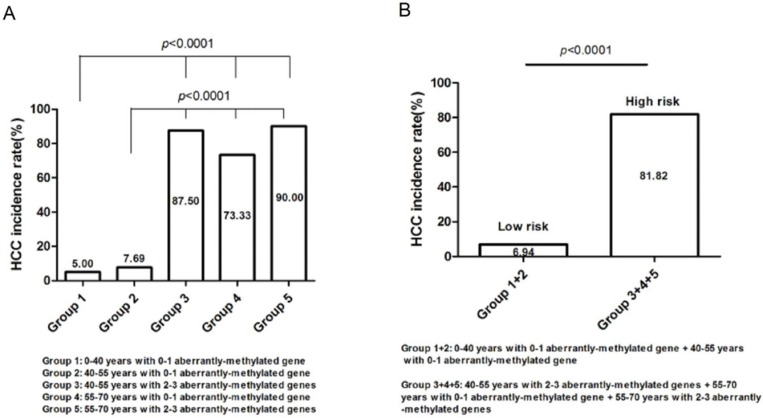
Figure 5.
Risk group classification based on the concurrent analysis of age and number of abnormally-methylated gene. (A). The relationship between HCC incidence rate and groups divided by diverse age and number of aberrantly-methylated gene. (B). High-risk and low-risk groups were defined according to the distinct difference of HCC incidence rate.

