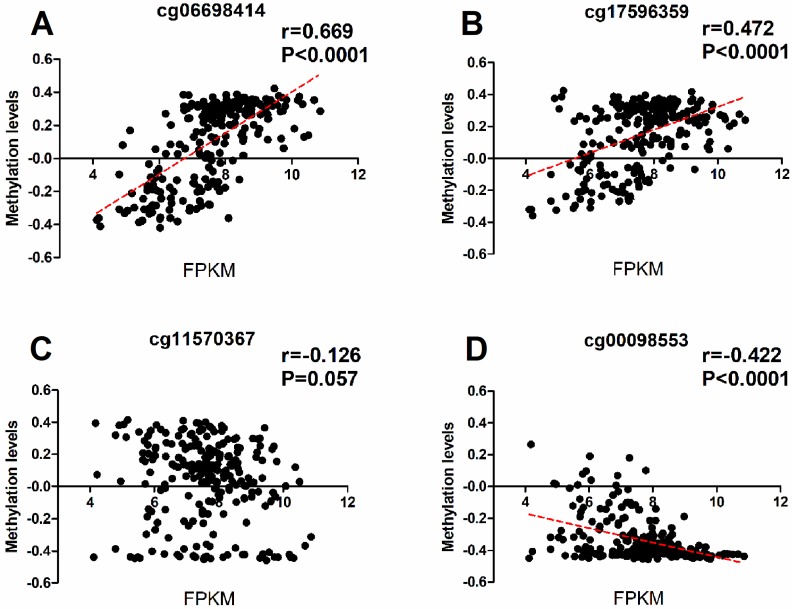
Figure 4.
The correlation between the methylation and expression data of RASA3 in four selected CpG sites closed to the amplicon studied. Cg06698141 and cg17596359 were next to the Amplicon 1 region, cg11570367 and cg00098553 were next to the Amplicon 2 region. (A), correlation analysis between the methylation levels of cg 06698414 and RASA3 gene expression. (B), correlation analysis between the methylation levels of cg 06698414 and RASA3 gene expression. (C), correlation analysis between the methylation levels of cg 06698414 and RASA3 gene expression. (D), correlation analysis between the methylation levels of cg 06698414 and RASA3 gene expression.

