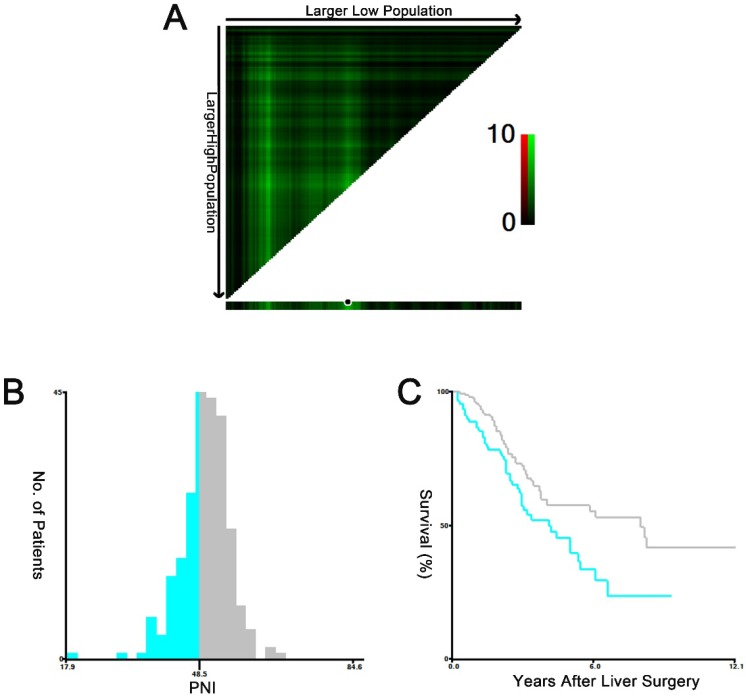
Figure 1.
The X-tile plots of the PNI and the OS of CRLM patients who underwent curative hepatic resection. The X-tile plots show the χ2 values with cut-off values, generating the low- and high-PNI subgroups. A X-tile plots of PNI expression for optimal cutoff point, which is demarcated by a black circle. B The histogram of the entire cohort divided into low-PNI and high-PNI subgroups according to the optimal cut-off value of 48.5. C Kaplan-Meier plot of survival rates in groups stratified by the optimal cut-off value of the PNI. Blue represents the low-PNI group, and gray represents the high-PNI group.

