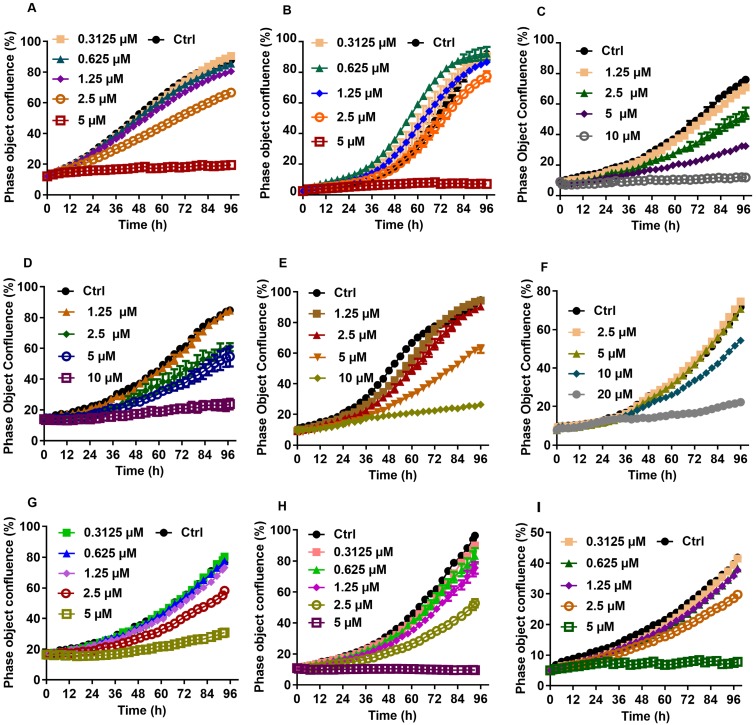
Fig 1.
Growth curves for individual liver cancer cell lines treated with various concentration of CTD. A: HepG2; B: Hep3B; C: Huh7; D: SUN-387; E: SUN-449; G: LM9; F: HCCC9810; H: RBE; I: QBC939. The result showed that cell lines of liver cancer are commonly sensitive to CTD, especially in HepG2 and Hep3B

