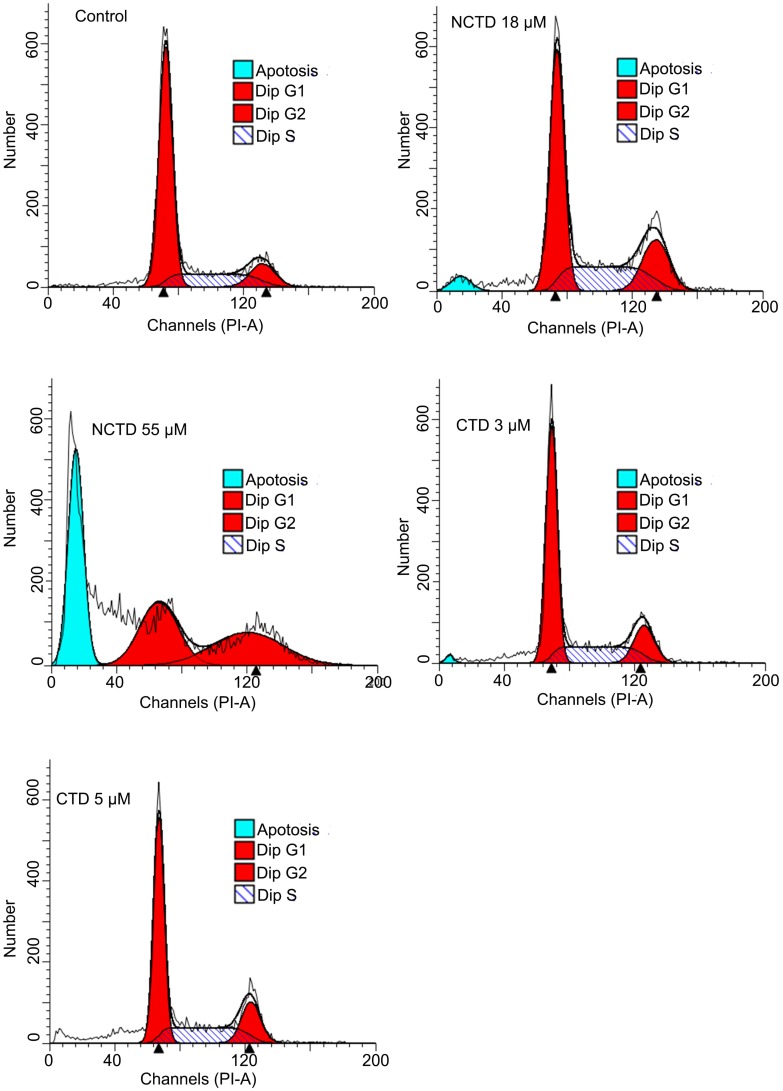
Fig 3.
DNA content-based flow data: Distinctive responses of HepG2 toward CTD and NCTD. when treated at equal potent growth inhibitory concentrations of CTD (IC50, 3 μM; IC90, 5 μM) and NCTD (IC50, 18 μM, IC90, 55 μM), only NCTD, caused a significant increase in the sub-G1 fraction, indicative of apoptosis; while CTD apparently caused a G1 cell cycle arrest.

