
Figure 5.
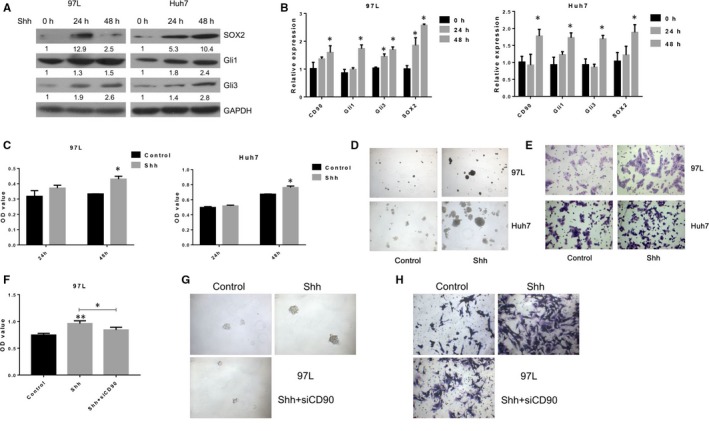
SHH treatment of CD90+ liver cancer cells. A & B, SOX2, Gli1 and Gli3 protein levels in CD90+ 97L and Huh7 liver cancer cells treated with SHH. Cells were treated with 0.4 g/mL SHH for 48 h, and Western blotting was performed to measure the protein abundance. GAPDH was used as the internal standard. C, Proliferation rates of CD90+ liver cancer cells in CD90+ liver cancer cells treated with SHH by the MTS assay. D, Sphere formation capacity of CD90+ liver cancer cells treated with SHH. E, Migration rates of CD90+ liver cancer cells in CD90+ liver cancer cells treated with SHH by the transwell assay. F, Proliferation rates of CD90+ liver cancer cells in CD90+ liver cancer cells treated with siCD90 and followed by SHH through the MTS assay. G, Sphere formation capacity of CD90+ liver cancer cells treated with siCD90 and followed by SHH. H, Migration rates of CD90+ liver cancer cells in CD90+ liver cancer cells treated with siCD90 and followed by SHH through the transwell assay. SHH: Sonic Hedgehog; GAPDH: glyceraldehyde‐3‐phosphate dehydrogenase; SOX2: Sex Determining Region Y‐Box 2. * indicates P < .05