Figure 5.

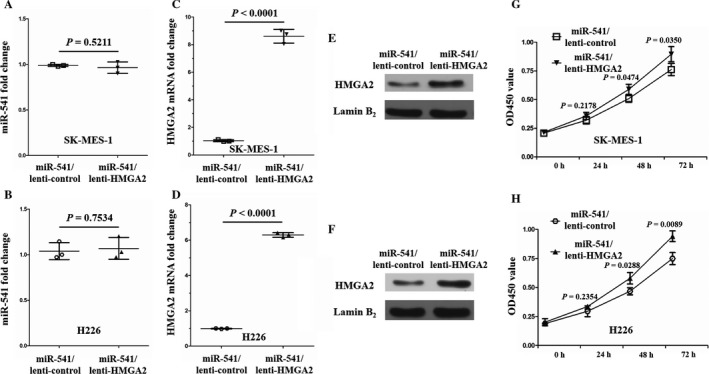
Successful HMGA2 overexpression in miR‐541‐overexpressing SK‐MES‐1 and H226 cells, and the enhanced proliferation of miR‐541‐overexpressing SK‐MES‐1 and H226 cells by HMGA2 overexpression. (A) The difference in the miR‐541 expression levels between the miR‐541/lenti‐HMGA2 and miR‐541/lenti‐control SK‐MES‐1 cells was not significant (n = 3 for each cell group). (B) HMGA2 overexpression in miR‐541‐overexpressing H226 cell also did not significantly change miR‐541 expression (n = 3 for each cell group). (C, D) Verification of HMGA2 mRNA overexpression in miR‐541‐overexpressing SK‐MES‐1 and H226 cells (n = 3 for each cell group). (E, F) The HMGA2 protein levels were significantly upregulated in the miR‐541/lenti‐HMGA2 SK‐MES‐1 and H226 cells. Lamin B2 served as the internal control. A bigger field scan of the blot is shown in Fig. S1. (G, H) Higher OD450 values were observed in the miR‐541/lenti‐HMGA2 SK‐MES‐1 and H226 cells than in the control cells at 48 and 72 h (n = 3 for each cell group). OD450, optical density at 450 nm.
