Figure 3.

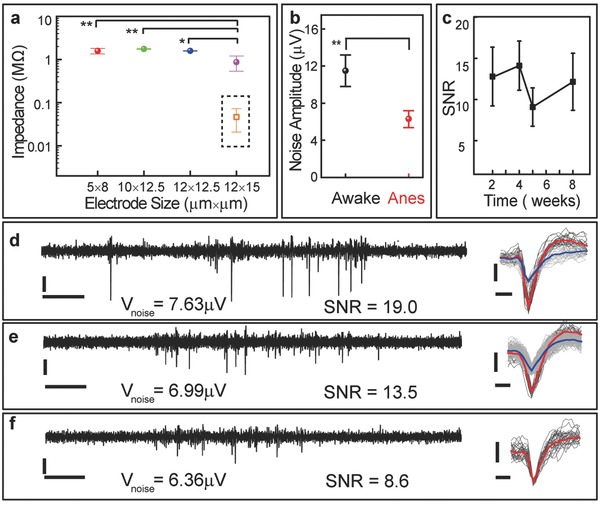
In vivo recording performance of NET‐e devices. a) In vivo impedance at 1 kHz measured at 1week after implantation, n = 20 for each dimension. Dashed box: impedance of electrodes with PEDOT coating (n = 6) measured in 1 × PBS. b) In vivo noise level of the smallest electrode (5 µm × 8 µm) at anesthetized (right, 6.46 µV median) and awake (left, 11.4 µV median) measurements (bandwidth: 0.5 Hz to 7.5 kHz), n = 20. Measurement time: 5 weeks after implantation. c–f) SNR of action potential recordings by NET‐e probes (n = 10 electrode sites of three NET‐e‐l probes in three anesthetized mice) over c) 8 weeks and representative recordings from three implanted NET‐e‐l electrodes in an anesthetized mouse d) 2 weeks and e,f) 5 weeks after implantation. Left: 1s real‐time recording trace; 250 Hz high‐pass filter applied. Right: Superimposed spikes isolated from the recording traces. All unit events were plotted in light gray and averaged waveforms plotted in red and blue. SNR was calculated using the larger waveform when there were two recorded on one electrode. Vertical scale bars: 50 µV, panels (c–e); horizontal scale bars: 0.1 s, panels (c–e, left) and 0.25 ms (c–e, right). The symbols * and ** in panels (a,b) denote significant difference of p < 0.01 and p < 0.001 between the groups, respectively.
