Figure 5.

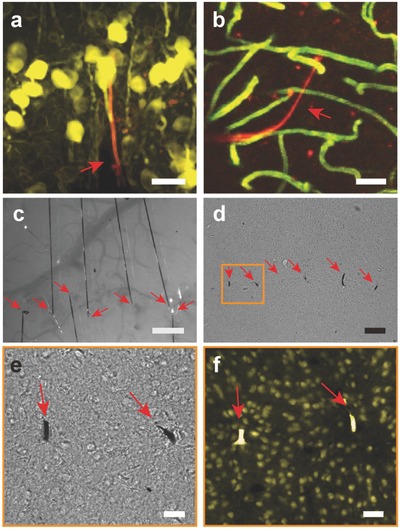
In vivo and postmortem tissue–probe interface. a) Reconstruction of in vivo 2P images of neurons (yellow, Thy1‐YFP) surrounding an NET‐e‐l probe (red) 2 months post implantation. Image stack: 100–320 µm below the brain surface. b) 3D reconstruction of vasculature by in vivo 2P microscopy around NET‐e‐l probe (red) 2 months postimplantation, showing normal capillary networks (green). Image stack: 100–320 µm below the brain surface. c) Photograph showing in vivo implantation of multiple NET‐e‐l probes. Arrows denote the implantation locations. d) Bright field image of a postmortem tissue slice at the probe–tissue interface as shown in panel (c) 4 months postimplantation. Arrows denote the probes. e) Zoom‐in bright field image of the boxed region shown in panel (d). Arrows denote the probes. f) Fluorescence image of the same area as in panel (e). Color code: yellow, NeuN, labelling neuron nuclei; Rhodamine 6G, labelling NET‐e probe. Normal neuronal density was observed near the two probes at inter‐probe distance was 60 µm. Scale bars: 50 µm, panels (a–d); 10 µm, panels (e,f).
