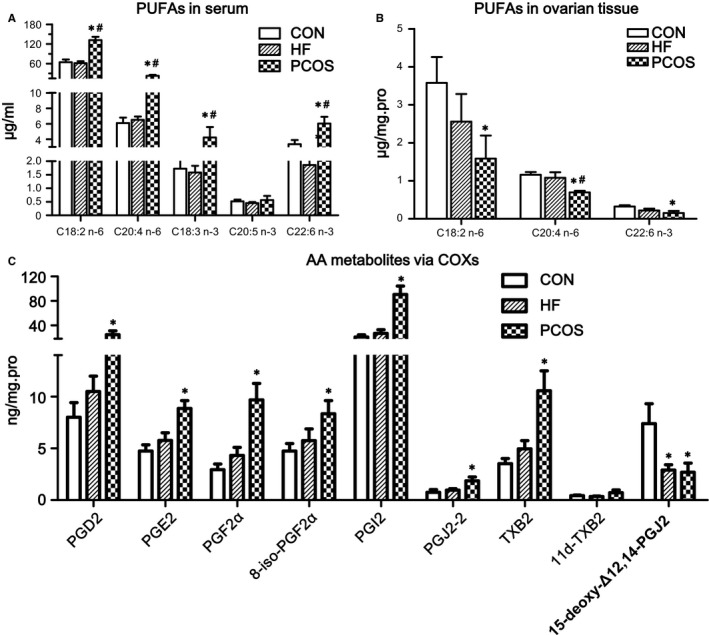
Figure 1.

Alterations of PUFAs and their metabolites in PCOS rats. Comparisons of changes in serum (A) and ovarian tissue (B) PUFA levels among the 3 groups. (C) Changes in AA metabolites by COX in the 3 groups. *Compared with the CON group, P < .05; #Compared with the HF group, P < .05. Serum PUFA levels are presented directly according to their concentrations. Because ovarian PUFA levels were measured in homogenized ovarian tissue, we adjusted the ovarian PUFA levels by total protein to make them comparable
