
Figure 3.
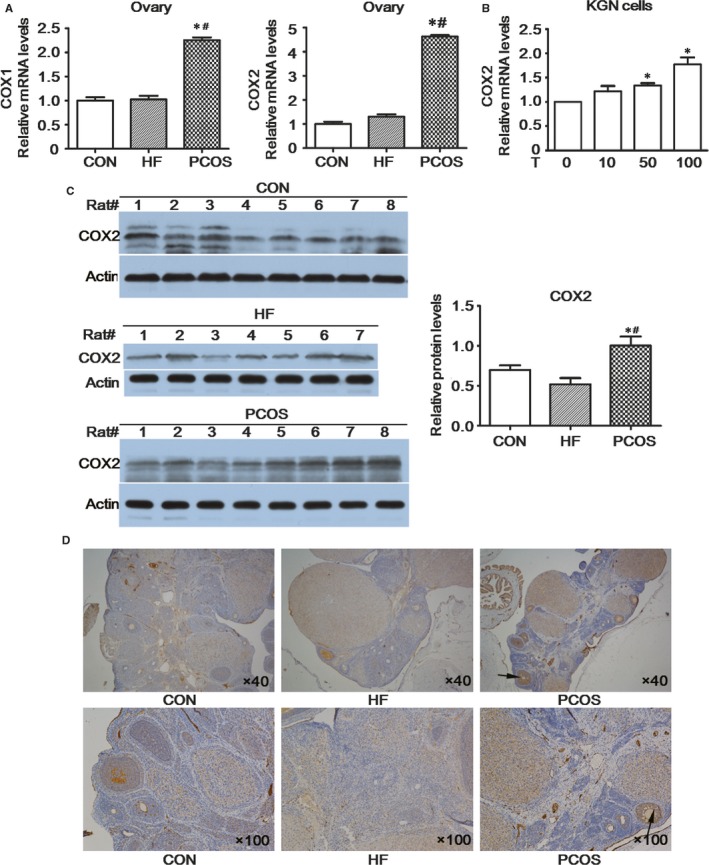
COX expression in rat ovarian tissue. A, COX gene expression levels in rat ovarian tissue. B, mRNA expression levels of various COX2 in KGN cells. C, Immunohistochemical evaluation of COX2 in rat ovarian tissue. D, COX2 protein content in rat ovarian tissues as determined by Western blot. Testosterone (10 nmol/L, 50 nmol/L and 100 nmol/L) was added to the KGN cells for 24 h. *Compared with the CON group or DMSO group, P < .05; #Compared with the HF group, P < .05