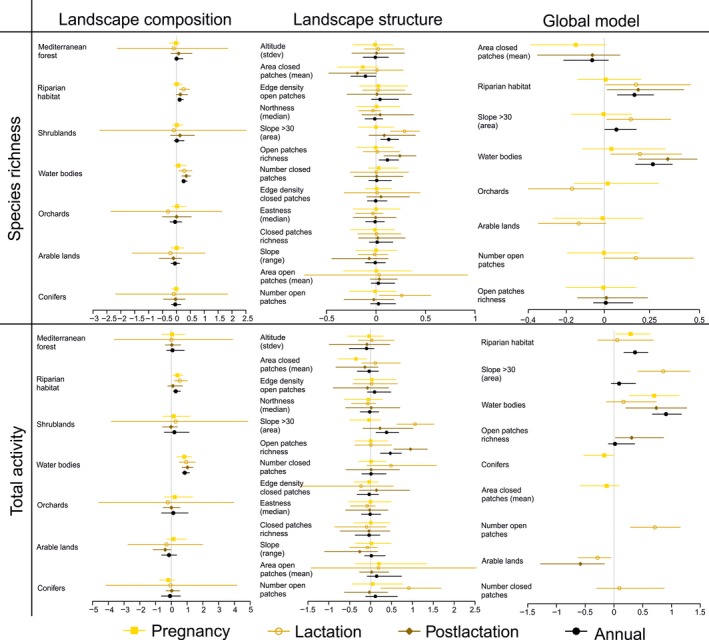
Figure 2.

Forest plots summarizing average models relating bat species richness and total activity to either landscape composition, landscape structure, or a combination of landscape composition and structure (global) variables in northeast Portugal. Different models were built for each phenological period (pregnancy—filled square, lactation—empty square, postlactation—filled diamond) and for data combined over the annual cycle (Annual—filled circle). For each average model, we plot the regression coefficient estimates and the corresponding 95% confidence interval for each variable included in the model. Details of each model are provided in Tables S2 and S3
