
Figure 3.
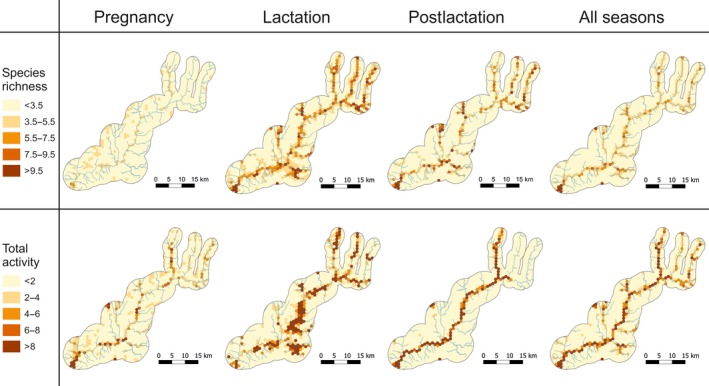
Spatial distribution of hotspots (hexagons) of bat species richness (>3.5 species per 15‐min interval) and total activity (>2 bat passes/min) in northeastern Portugal, estimated from the spatial projection of the global landscape models provided in Tables S2 and S3. Separate maps are provided for each phenological period (pregnancy, lactation, and postlactation) and for data combined over the annual cycle