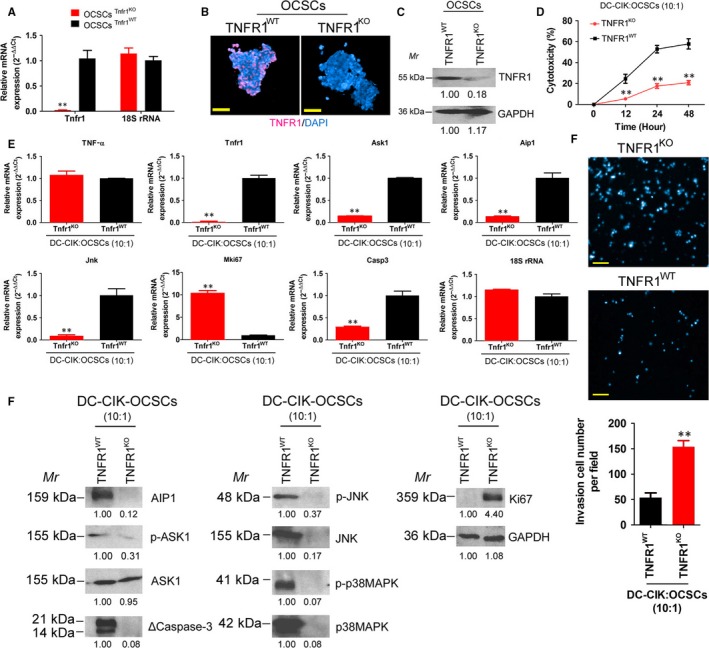
Figure 6.

TNFR1 knockout OCSCs were resistant to OCPMB‐derived DC‐CIK cells. A, The qPCR results showed that the expression level of endogenous TNFR1 in the OCSC group transfected with the human TNFR1 CRISPR/Cas9 KO plasmid was significantly lower than that in the group transfected with an empty plasmid. **P < .01 vs OCSCs Tnfr1 WT; n = 4; B, Immunofluorescence staining results showed that OCSCs in the TNFR1KO group barely expressed any TNFR1 protein. Scale bar = 30 μm; C, The Western blot results showed that the expression of endogenous TNFR1 protein in the OCSCs from the TNFR1KO group was significantly lower than that in the TNFR1WT group; D, The cytotoxicity experiment results showed that the cytotoxicity of DC‐CIK cells on OCSCs in the TNFR1KO group was significantly lower than that in the control group. **P < .01 vs OCSCs Tnfr1 WT; n = 4; E, The qPCR results showed that the mRNA expression levels of Tnfra, Ask1, Aip1, Jnk and caspase‐3 in OCSCs in the DC‐CIK‐TNFR1KO group were significantly lower than that in the DC‐CIK‐TNFR1WT group; F, The transwell experiment results showed that the number of migrated OCSCs in the DC‐CIK‐TNFR1KO group was significantly higher than that in the control cell group. **P < .01 vs OCSCs Tnfr1 WT; n = 4. Scale bar = 30 μm; G, Western blot results showed that the expression levels of AIP1, p‐ASK1, JNK, p‐JNK, p38MAPK, p‐p38MAPK and activated caspase‐3 in OCSCs in the DC‐CIK‐TNFR1KO group were significantly lower than those in the DC‐CIK‐TNFR1WT group. **P < .01 vs OCSCs Tnfr1WT; n = 4
