
Figure EV5. Transcriptomic and epigenetic changes associated with Factor 1 in the scMT data.
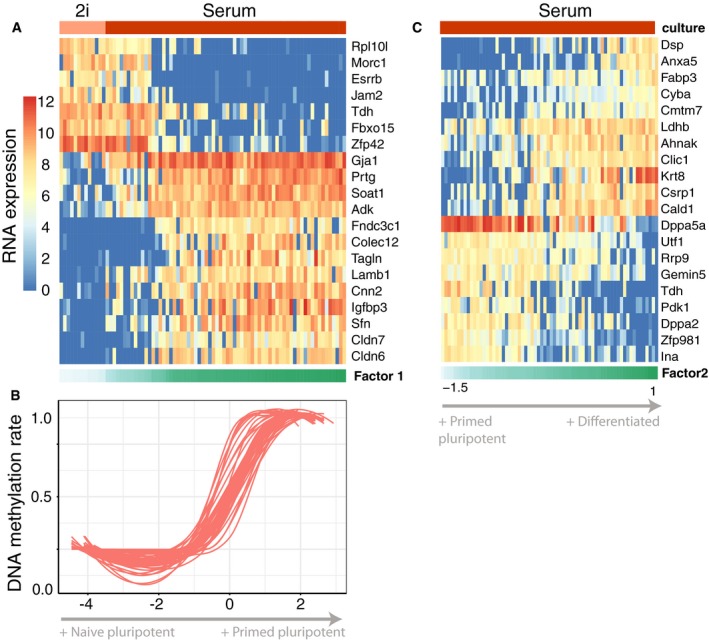
- RNA expression changes for the top 20 genes with largest weight on Factor 1.
- DNA methylation rate changes for the top 20 CpG sites with largest weight. Shown is a non‐linear loess regression model fit per CpG site.
- RNA expression changes for the top 20 genes with largest weight on Factor 2.