
Figure 3.
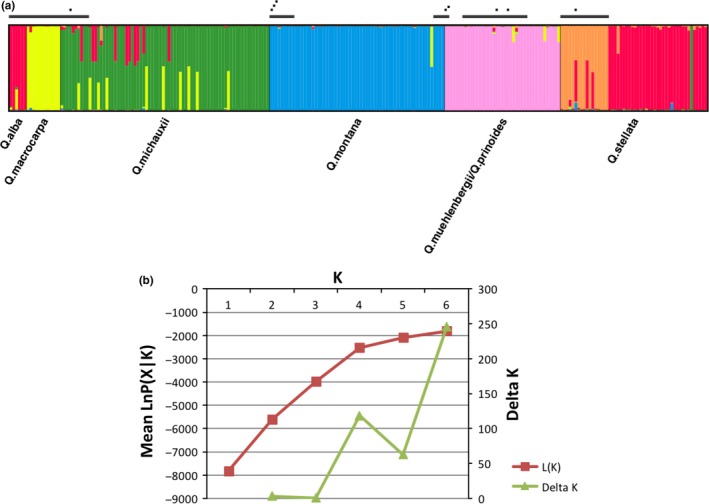
STRUCTURE analysis to assess rate of hybrid offspring by non‐native North American white oaks within the oak living collections at The Morton Arboretum. (a) Genetic assignment of 247 individuals at 66 loci according to MCMC clustering method implemented in STRUCTURE (Pritchard et al., 2000). DISTRUCT v1.1 was used for the visualization (Rosenberg, 2004). Vertical black lines represent grouping of individuals according to their population assignment. Each vertical line color‐codes the genotype probability of an individual according to population grouping. Black bars over individuals represent adult trees. Black dots over individuals represent mother trees producing acorns genotyped in this study. (b) Estimation of best cluster number (K) calculated by STRUCTURE with respect to mean log likelihood of the data over five iterations (left axis) and ΔK plotted as a function of K (K = 1–6) (right axis)