
Figure 2.
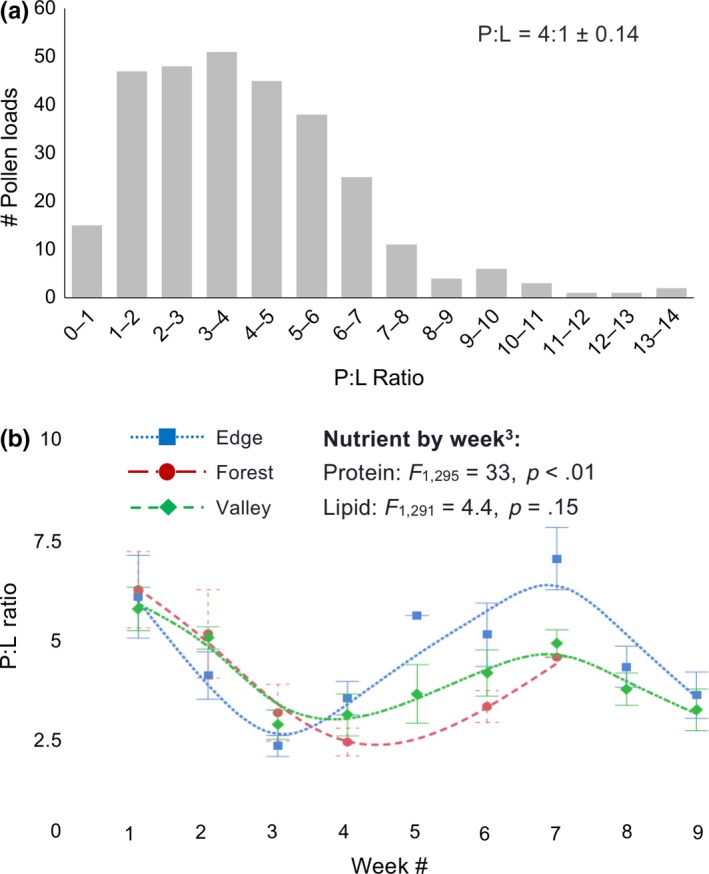
Distributions of protein:lipid ratios (P:L) from pollen collected from the corbiculae of individual Bombus impatiens foragers. (a) Distribution of P:L ratios of all individual forager pollen loads collected (N = 297). Bars represent total numbers of corbiculate loads found within a given P:L range. (b) Mean P:L ratios (±SE) of pollen loads for each week of the study by habitat. P:L ratios did not differ between habitats each week yet exhibited a third‐order polynomial distribution over time. The smooth line was added to show the similar trends in pollen nutrition collected by colonies throughout the season in each habitat. Smoother lines are a cubic spline with lambda of 0.1 generated by JMP Pro 13.2.0. Note that protein concentrations of pollen collected by B. impatiens differed by week while lipid concentrations did not, suggesting that P:L ratios were driven by protein concentrations of pollen collected by bumble bees (see Section 2.1, Table 1)