
Figure 3.
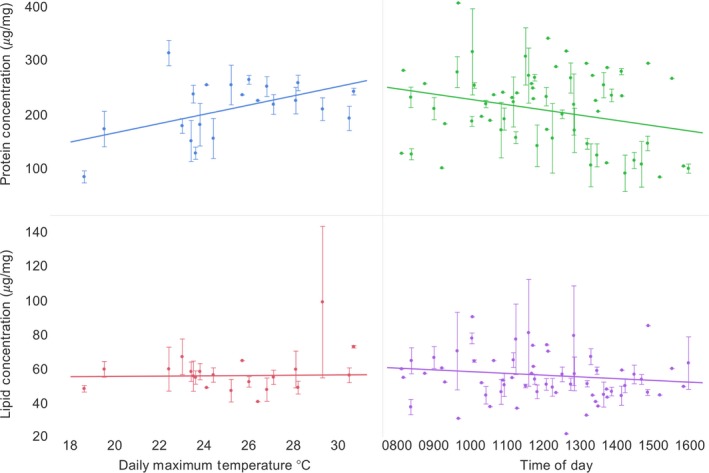
Regression of environmental variables on Bombus impatiens pollen nutrient concentrations. We conducted multiple regression on daily temperatures and time of day on pollen nutrient concentrations (shown as mean ± SE) collected by bumble bees. Protein concentrations of bumble bee‐collected pollen differed by maximum daily temperature and time of day (F 3,98 = 10.93, p < .01, R 2 = .26), while lipid concentrations did not (F 3,89 = 0.44, R 2 = .015) revealing environmental effects on bumble bee collection of pollen protein concentrations and consistent collection of pollen lipid concentrations