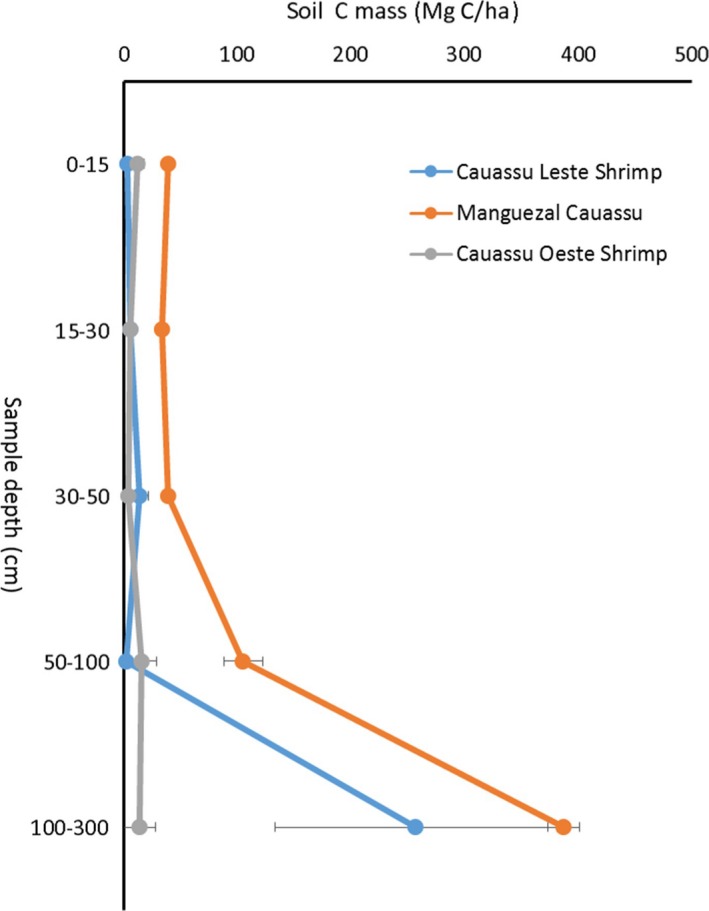
Figure 3.

The mass of soils broken down by depth for the mangrove (Manguezal Cauassú) and two adjacent shrimp ponds—Cauassú Leste and Cauassú Oeste. The colored circles represent the mean soil carbon mass for the sampled depths of the entire soil profile. Horizontal bars represent one standard error of the mean carbon mass for the sampled depth
