
Figure 4.
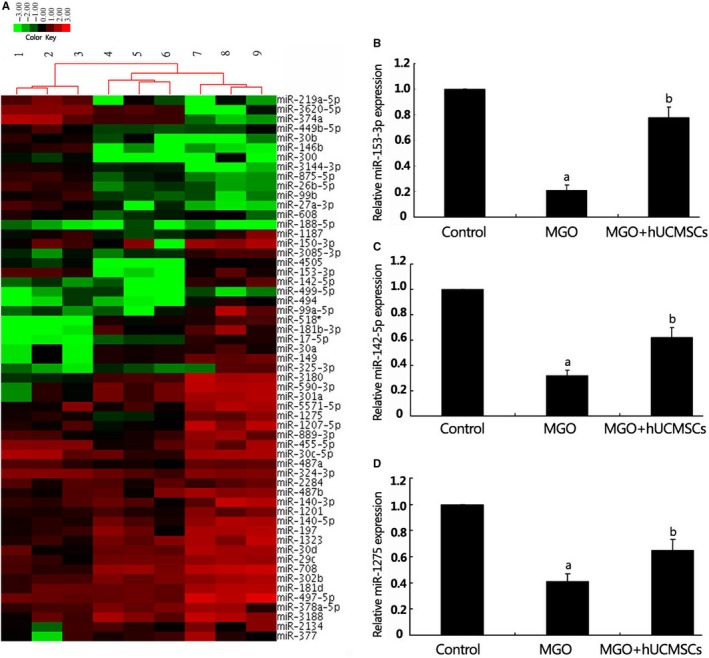
Analysis of miRNA expression profiles associated with epithelial to mesenchymal transition (EMT). A, a hierarchical clustering heat map of miRNA expression profile was obtained using fold change in miRNA expression. The analysis categorized three clusters corresponding to Group Control, Group MGO and Group MGO + hUCMSCs. The method of complete linkage was used as a clustering method. B‐D, the expression of miR‐153‐3p (B), miR‐142‐5p (C) and miR‐1275 (D) was significantly decreased in Group MGO relative to Group Control and up‐regulated in Group MGO + hUCMSCs. a P < .05 vs control group, b P < .05 vs Group MGO (n = 6)