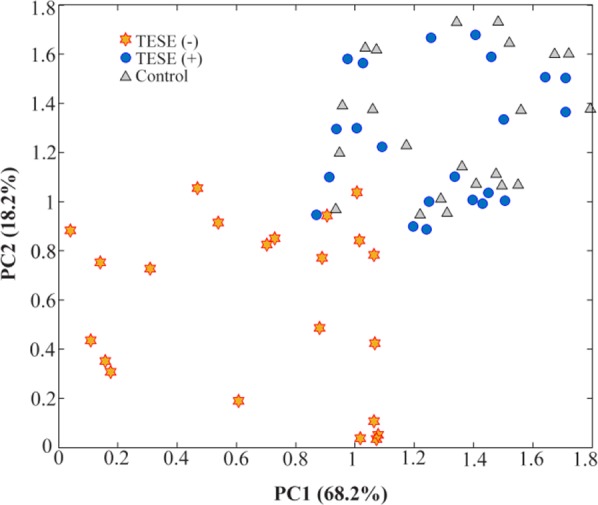
Figure 1.

The results of principle component (PC) analysis of the data matrix of fertile ( ), TESE (
 ) versus TESE(−) (
 ). Each patient was analyzed in triplicate

The results of principle component (PC) analysis of the data matrix of fertile ( ), TESE (
 ) versus TESE(−) (
 ). Each patient was analyzed in triplicate