Figure 1.

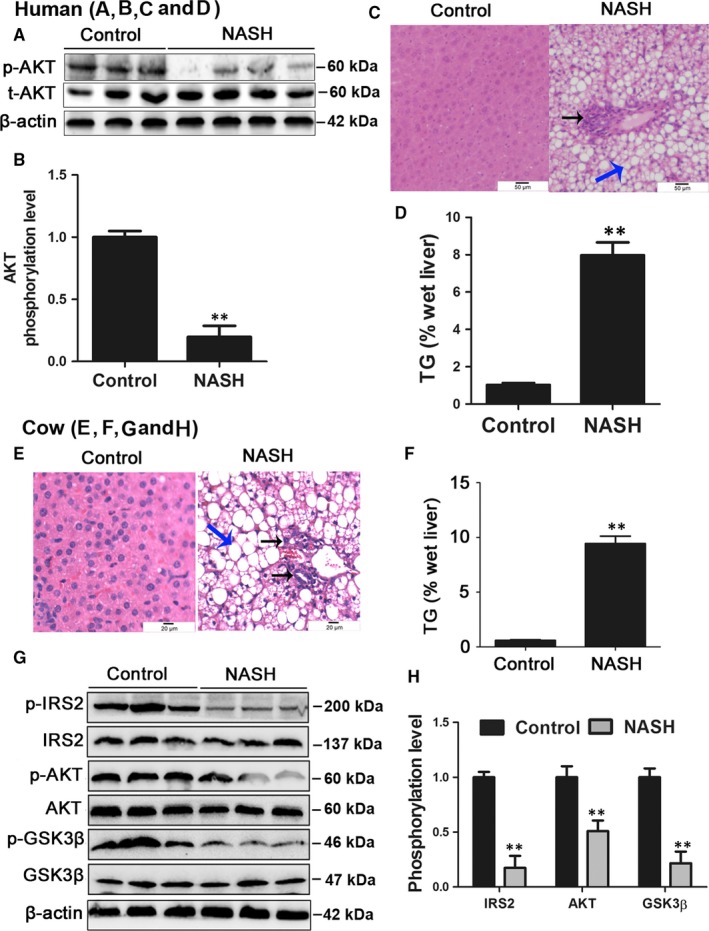
Patients and cows with NASH displayed insulin resistance and hepatic steatosis. A, B, The hepatic phosphorylation level of AKT (p‐AKT/AKT) in patients with NASH and controls. C, HE staining of liver histology from control and NASH patient (original magnification ×20). Black arrow, inflammatory infiltration; Blue arrow, lipid droplet. D, Hepatic TG content in patients with NASH and controls. E, HE staining of liver histology from control and NASH cows (original magnification ×40). Black arrow, inflammatory infiltration; Blue arrow, lipid droplet. F, Hepatic TG content in control and NASH cows. G, H, The hepatic phosphorylation levels of AKT, GSK3β and IRS2 in control and NASH cows. All data are expressed as mean ± SD. *P < .05 and **P < .01 compared with control group. Subjects: eight patients with NASH and six healthy subjects. Cows: twenty healthy Holstein cows and ten cows with NASH. Each treatment was repeated 8 times. NASH, non‐alcoholic steatohepatitis; AKT, protein kinase B; TG, triglyceride; GSK3β, glycogen synthesis kinase 3 beta; IRS2, insulin receptor substrate 2; SD, standard deviation
