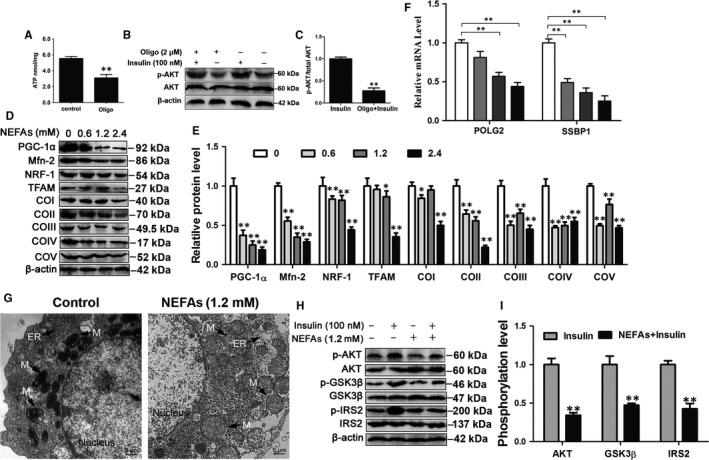
Figure 3.

NEFA treatment induced mitochondrial dysfunction and insulin resistance. A, The ATP content. Cow hepatocytes were treated with 2 μmol/L oligo for 6 h. B and C, Western blot analysis and quantification of p‐AKT and AKT in cow hepatocytes. Cow hepatocytes were treated with 2 μmol/L Oligo for 6 h and then treated with or without 100 nmol/L insulin for 30 min. D, E and F, Hepatocytes were treated with 0, 0.6, 1.2 and 2.4 mmol/L NEFAs, respectively. D and E, Western blot analysis and quantification of PGC‐1α, Mfn‐2, NRF1, TFAM and five representative subunits of OXPHOS complexes. F, The mRNA levels of POLG2 and SSBP1. G, Representative TEM images of hepatocytes treated with 1.2 mmol/L NEFAs at ×2500 magnification. Scale bar, 5 μm. H and I, Cow hepatocytes were treated with 1.2 mmol/L NEFAs in the absence or presence of 100 nmol/L insulin. The phosphorylation of AKT, GSK3β and IRS2 was analysed by Western blots. All data represent the mean ± SD. *P < .05 and **P < .01 compared with no treatment group. Each treatment was repeated 8 times. NEFAs, non‐esterified fatty acids; OXPHOS, oxidative phosphorylation; POLG2, gamma DNA polymerase; SSBP1, single‐strand DNA binding protein 1
