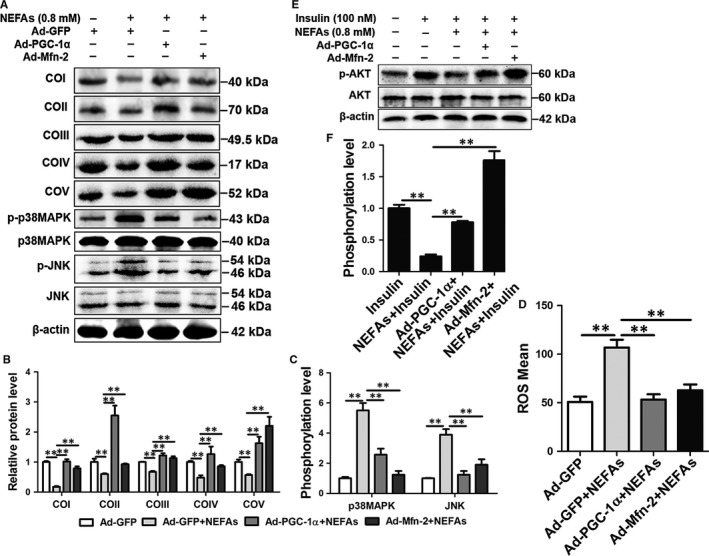
Figure 7.

Overexpression of PGC‐1α or Mfn‐2 improved mitochondrial dysfunction and insulin resistance induced by NEFAs in HepG2 cells. A‐D, HepG2 cells were infected with Ad‐GFP, Ad‐PGC‐1α and Ad‐Mfn‐2, and then treated with 0.8 mmol/L NEFAs. A, B and C, Western blot analysis and quantification of JNK, p‐JNK, p38MAPK, p‐p38MAPK and five representative subunits of OXPHOS complexes. D, ROS content. E and F, Western blot analysis and quantification of p‐AKT and AKT. HepG2 cells were infected with Ad‐GFP, Ad‐PGC‐1α, and Ad‐Mfn‐2, and then treated with 0.8 mmol/L NEFAs and/or 100 nmol/L insulin. All data represent the mean ± SD. *P < .05 and **P < .01 compared with no treatment group. Each treatment was repeated 8 times
