Figure 2.

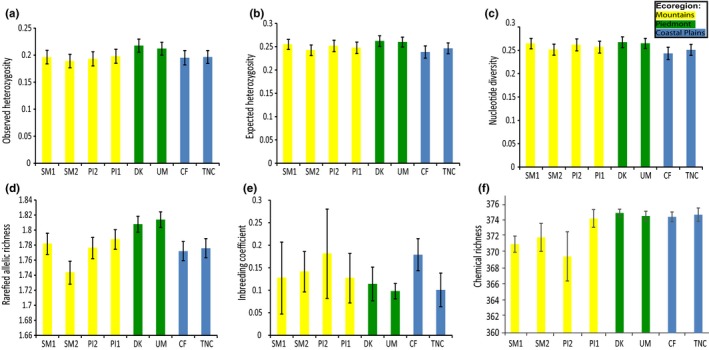
Comparison of subpopulation means of (a) observed and (b) expected heterozygosity, (c) nucleotide diversity, (d) rarefied‐allelic richness, (e) inbreeding coefficient, and (f) chemical richness calculated from 377 metabolites

Comparison of subpopulation means of (a) observed and (b) expected heterozygosity, (c) nucleotide diversity, (d) rarefied‐allelic richness, (e) inbreeding coefficient, and (f) chemical richness calculated from 377 metabolites