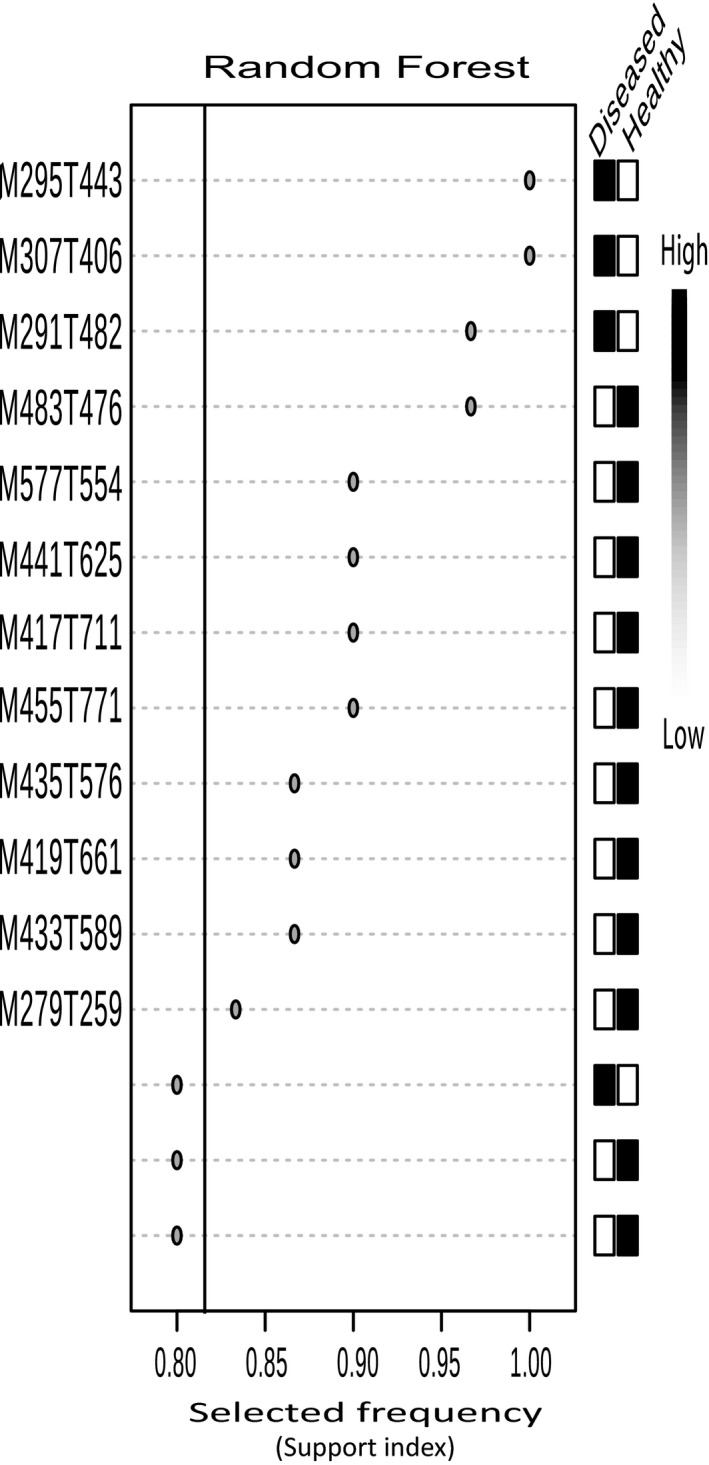
Figure 8.

Top random forest (RF) results of biomarkers indicative of healthy or diseased plants. Metabolites arranged top to bottom based on ranked importance, and labeled metabolites right of solid black line on plot were considered for biomarker selection. Panel right of support index panel for biomarker tests indicates relative expression of each compound in healthy versus diseased plants with black shades representing higher expression and white shades representing lower expression
