
Figure 2.
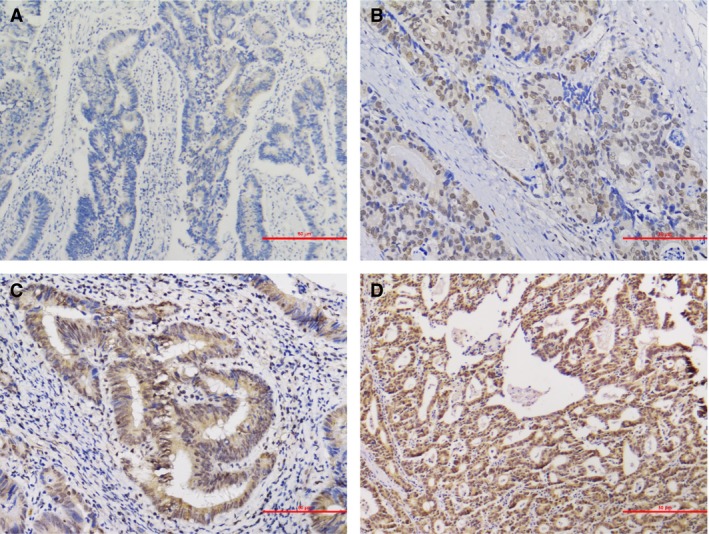
Different XPA expression levels in CRC tissues. (A) negative (−), (B) weakly positive (+), (C) moderately positive (++), and (D) strongly positive (+++). Magnification, ×200.
Official websites use .gov
A
.gov website belongs to an official
government organization in the United States.
Secure .gov websites use HTTPS
A lock (
) or https:// means you've safely
connected to the .gov website. Share sensitive
information only on official, secure websites.
Different XPA expression levels in CRC tissues. (A) negative (−), (B) weakly positive (+), (C) moderately positive (++), and (D) strongly positive (+++). Magnification, ×200.