
Figure 1.
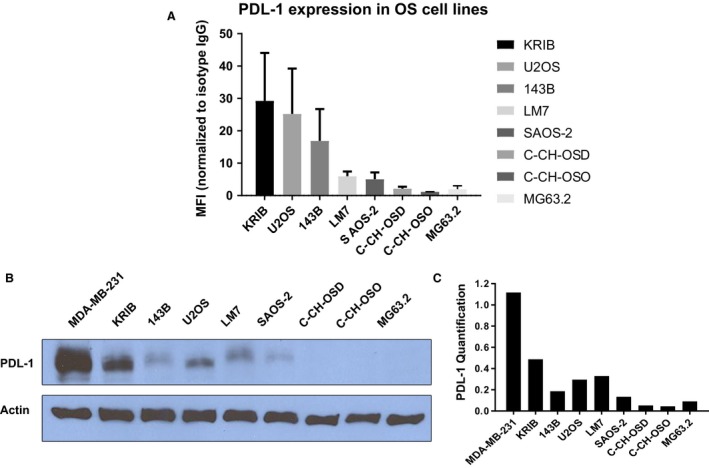
PDL‐1 is expressed in OS cell lines. Flow cytometry was performed using IgG‐APC or PDL‐1‐APC antibody. MFI (PDL‐1 positivity) normalized to IgG controls, standard deviations from three independent experiments are shown (A); Western blotting was performed using 10% SDS‐PAGE and anti‐hPDL‐1 antibody; MDA‐MB‐231 cells were positive control (B); ImageJ analysis was used for PDL‐1 (relative to actin) quantification (C).