
Figure 4.
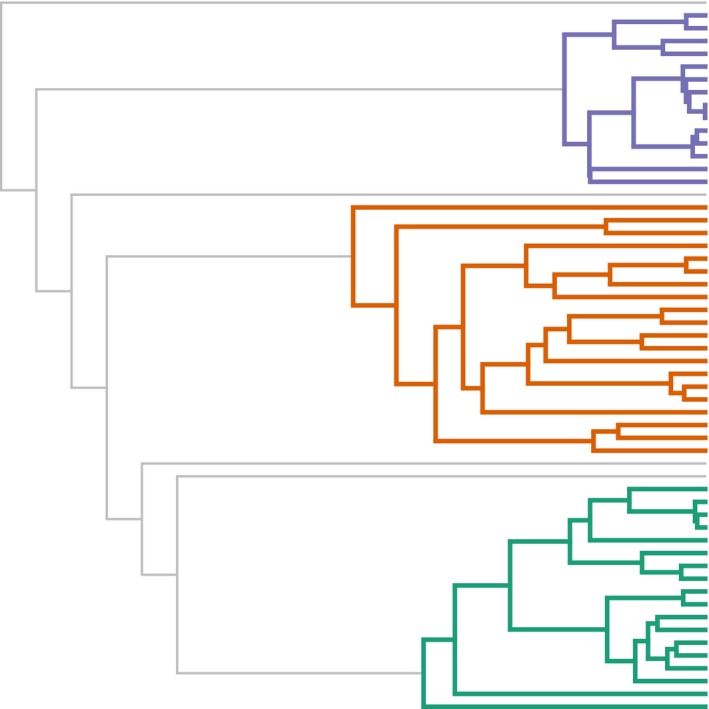
Example scenario for this method for comparing diversification rates among trees, but in which the relationship among phylogenies is known or hypothesized. The various colored subtrees represent the clades of interest and of known sampling fraction, where the remaining gray branches show poorly sampled lineages or lineages of unknown sampling fraction, and for which no a priori hypothesis exists for variation in speciation or extinction rates across the phylogeny