
Figure 4.
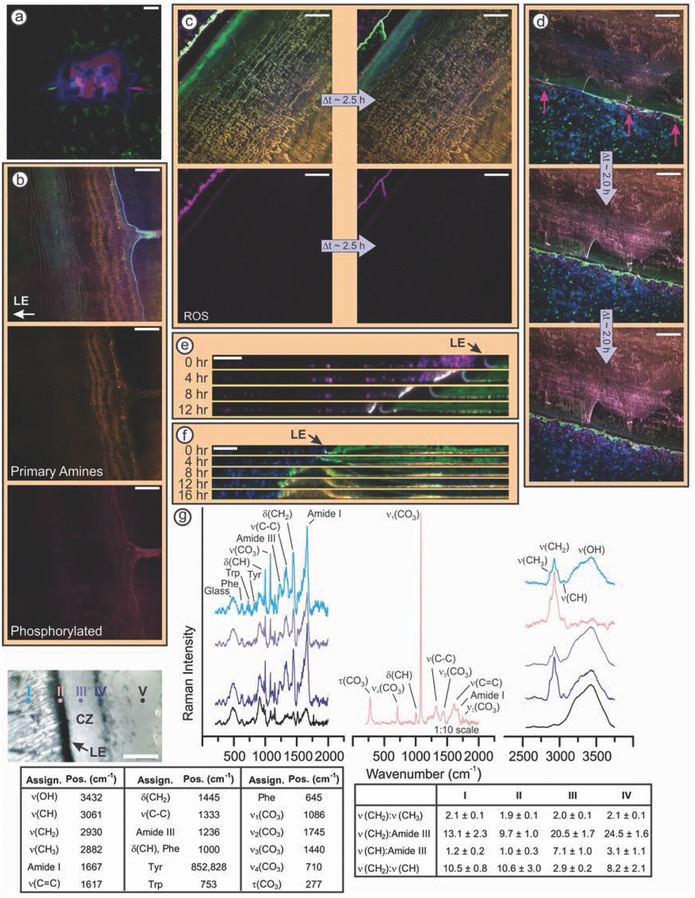
a–d) Confocal microscopy images of barnacles in ASW containing a nucleic acid probe (DAPI, blue), a neutral lipid probe (Bodipy 493/503, green), a primary amine probe (Alexa Fluor 647 NHS, orange), and either (a,b) a phosphoprotein probe (Pro Q Diamond, magenta), (c) a reactive oxygen species (ROS) probe (CellROX orange, magenta), or d,e) a reactive carbonyl species probe (Alexa Fluor 555 hydrazide, magenta). (a) Cyprid cement is heavily phosphorylated, whereas (b) barnacle cement nanofibrils are not phosphorylated. (c) Lipidaceous secretion accumulates inside the perimeter and disperses outside the perimeter. ROS are only observed after the secretion phase separates in ASW. (d) Regions of the surrounding biofilm within 10 µm of the lipidaceous secretion stain positive for reactive carbonyl species. (e) Orthogonal view of a 10 µm Z‐stack showing the removal of organic matter by the lipidaceous secretion. f) Orthogonal view of an 8 µm Z‐stack showing the clearance and subsequent protein deposition in the void under the lifted leading edge. g) Raman spectra correspond to the region marked in the optical image. The cleared zone (CZ) corresponds to the nonlabeled phase in (c) and (d). Unique bands were not observed, only varying intensities, with the exception of the calcite bands at the leading edge (region II).31 The position of the Amide I bands in regions I–IV (1667 cm) corresponds to β‐sheets,32 and agrees with previous in situ infrared spectroscopy of the adhesive interface.33 Tables show vibrational band assignments,34 and intensity ratios (N = 3; mean ± 95% confidence interval). All scale bars represent 20 µm.