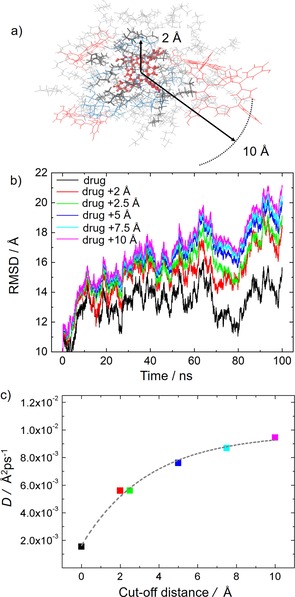
Figure 3.

a) Schematic representation of the drug Temoporfin and the surrounding residues used in the RMSD analysis. The molecules represented with bolder lines are found in a sphere of 2 Å radius centered at the drug. Thinner lines represent instead residues inside a sphere of 10 Å radius. b) RMSD of the residues contained in the different size spheres surrounding the drug residues during the NPT simulation. c) Diffusion coefficient reported against the separation from the drug molecules. The color scheme is the same as in (b).
