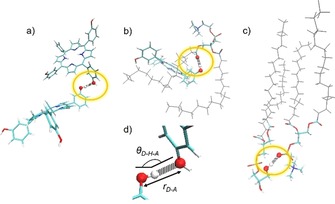
Scheme 1.

Schematic representation of the three categories considered for the hydrogen‐bond analysis: drug–drug pair forming a hydrogen bond (a), drug–head pair involved in a hydrogen bond (b), and two phospholipids connected through a hydrogen bond between the polar head residues (c). The tails of the phospholipids are pictured in gray, whereas, for the residues involved in the bonds, the color scheme is red for oxygen atoms, blue for nitrogen, tan for phosphate, cyan for carbons, and white for hydrogens. d) A zoom on the atoms involved in the hydrogen bond (encircled in yellow in the previous panels), with the geometrical parameters shown.
